真的假的? 1個年複利報酬60%的懶人美股及美股ETF投資組合!?

by yyp20

緣起:

2021/11/14 補注: 請注意本篇在撰寫當時的假設是用MTUM的”現有持股”去做回測, 但MTUM每半年都會換股, 建議到黑石的網站找每月的持股來回測, 結果會大不同.

https://www.blackrock.com/americas-offshore/en/products/251614/ishares-msci-usa-momentum-factor-etf

這週阿批心血來潮, 想到一個美股相關的投資策略點子, 融合兩個絕讚的因子:

  1. 應用冠軍策略, 也稱加速雙動能, Accelerating Dual Momentum, 由Gary Antonacci的雙動能系統演化而來,是阿批去Hahow上”小資族ETF狠會賺投資法“學來的. 冠軍策略本身的邏輯是: 在一堆個股中挑最強的持有, 如果都不強就出場, 每個月底用Portfolio visualizer檢查一次, 依訊號作投資組合的切換, 即可獲得超越大盤的獲利.
  2. 動能因子ETF, 就是把市場裡過去一段時間表現最強的股票挑出來湊成一堆變一支ETF, 可能一次持有個100支, 每一段時間會重新計算挑選. 實際上去看ETF的持股, 裡面還是有強有弱, 所以只要去動能ETF裡去挑最強的強勢股持有, 不就有專業經理團隊, 用Smart beta的技術幫忙先篩選出最強的強勢股了嗎?

Over time. individual factors have delivered outperformance relative to the market. Since March 2009, the MSCI World Momentum index 
has been the leading performer amongst the factor indexes. Over the period 2001-2016, despite there being a number of momentum 
crashes, the momentum index has recovered swiftly and outperformed the five other factors discussed in this brochure series. 
MSCI WORLD FACTOR INDEXES 
200' 2002 2003 2005 zoos 2008 2m' 2010 zon 2012 2013 20" 201s 
From a longer-term perspective. the simulated MSCI World Momentum Index has generated an annualized return of more than 13% 
during a LO-year period (see chart below). In comparison to other factor indexes over the same period. the momentum factor index 
tends to be at the higher end Of the risk/return spectrum. 
MSCLCOM 
MSCI
根據MSCI的研究, 動能因子被證實為可以在長期獲得超額報酬的因子, 有動能因子ETF也不奇怪.

1

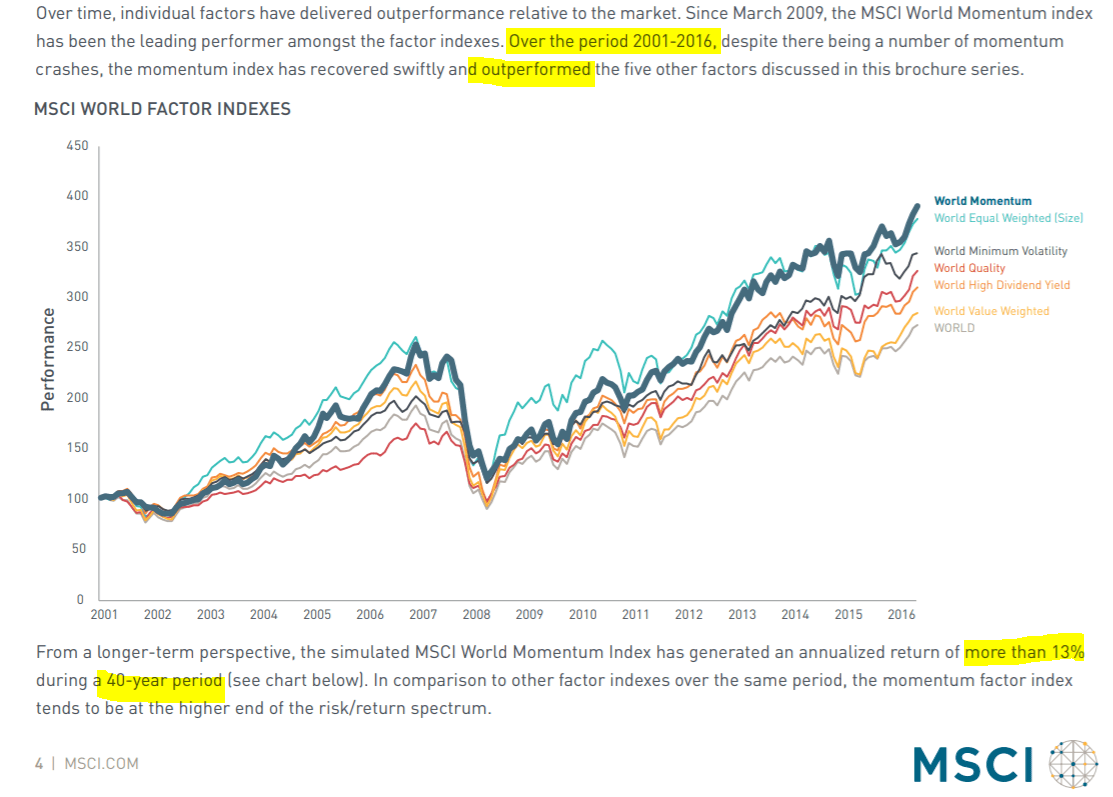
由於冠軍策略自帶擇強持有+閃過崩盤的屬性, 原始的冠軍策略, 使用指數型ETF, 在2000年及2008年那種環境都是賺錢的(如下圖),如果使用強勢股中的強勢股, 那不是開外掛了?所以阿批決定來實驗這個策略.

原始版的冠軍策略在歷次股災中都是以正報酬作收.

1

實驗使用的ETF:

1. MTUM:

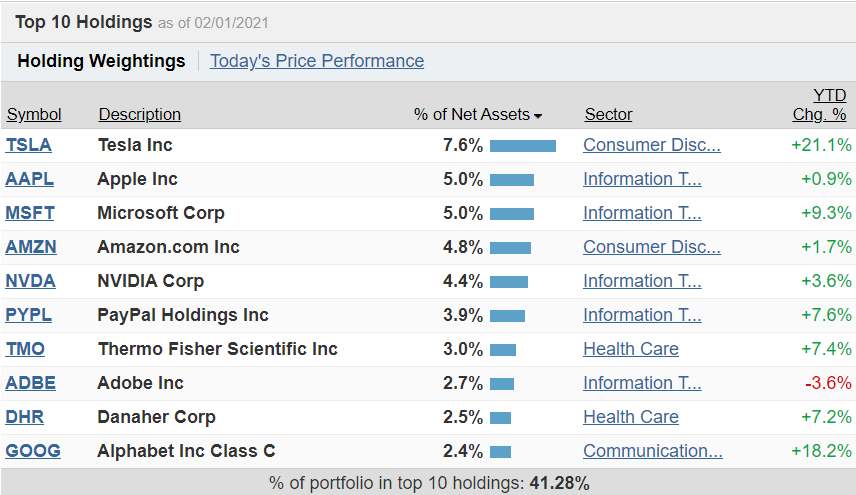
iShares MSCI美國動能因子ETF, 追蹤MSCI USA Momentum SR Variant Index, 在美國大型股及中型股中, 從過去6個月及12個月的股價表現中挑出相對強勢的個股, 給它一個動能分數, 再由動能分數以市值加權去算出要買多大比例, 每半年會再平衡一次,  換句話說, 強勢的大型股, 或是非常強勢但不那麼大的中型股就會是MTUM的核心持股, 每半年他會重新算一次, 調整持股.

MTUM前十大持股:

Top 10 Holdings 
as ot 02'01'2021 
Holding Weightings 
Sym" 
TS_VA 
MSFT 
AMZN 
NVPA 
pypL 
PHR 
Q%Øptiqn 
Tesla Inc 
Apple Inc 
Microsoft Corp 
Amazon.com Inc 
NVIDIA Corp 
PayPal Holdings Inc 
Thermo Fisher Scientific Inc 
Adobe Inc 
Danaher Corp 
Alphabet Inc Class C 
% of Net Assets 
7.6% 
4.8% 
3.9% 
3.0% 
2.7% 
2.5% 
Consumer Disc. 
Communication. 
-3.6% 
% of portfolio in top 10 holdings: 41.28%
MTUM的前幾大持股都是大家耳熟能詳的大公司

1

2. XMMO:

Invesco標普中型股動能組合ETF, 這支是美國中型股動能ETF, 追蹤MSCI中型400指數中過去12個月股價相對強勢的個股, 給一個動能分數, 再以市價加權決定要買多少.

https://www.moneydj.com/etf/x/basic/basic0003.xdjhtm?etfid=xmmo

XMMO前十大持股:

Top 10 Holdings 
of 02/020021 
Holding Weightings 
Today:s.Price-Pertormance 
Synm 
MPWR 
SAM 
MAS] 
CG_NX 
QescLi&n 
Generac Holdings Inc 
SolarEdge Technologies Inc 
Monolithic Power Systems Inc 
Boston Beer Co Inc Class A 
Masimo Corp 
Cognex Corp 
Quidel Corp 
Charles River Laboratories 
Internationa... 
Bio -Techne Corp 
Cable One Inc 
% of Net Assets. 
4.4% 
3.3% 
2.6% 
2.3% 
2.3% 
Industrials 
Tecnnology 
% Of portfolio in top 10 holdings: 28.32% 
-3.8% 
-0.1% 
-3.6% 
.318% 
-7.8% 
Al_LHQlßings
美國的中型強勢股看起來就陌生不少了吧? 漲起來一點也不輸大型股.

4. VGLT:

Vanguard發行的美國長期國債ETF, 基上和TLT是類似的組成, 為這次冠軍策略的出場持有資產.

https://www.moneydj.com/etf/x/basic/basic0003.xdjhtm?etfid=vglt

5. VOO

Vanguard標普500指數ETF,這次用為單一絕對動能開關股.

https://www.moneydj.com/etf/x/basic/basic0003.xdjhtm?etfid=voo

1

1

實驗開始囉!

1

實驗一: MTUM+冠軍策略(股票數9, 持股1, 出場持有VGLT, 一個月看一次, 不使用單一絕對動能)

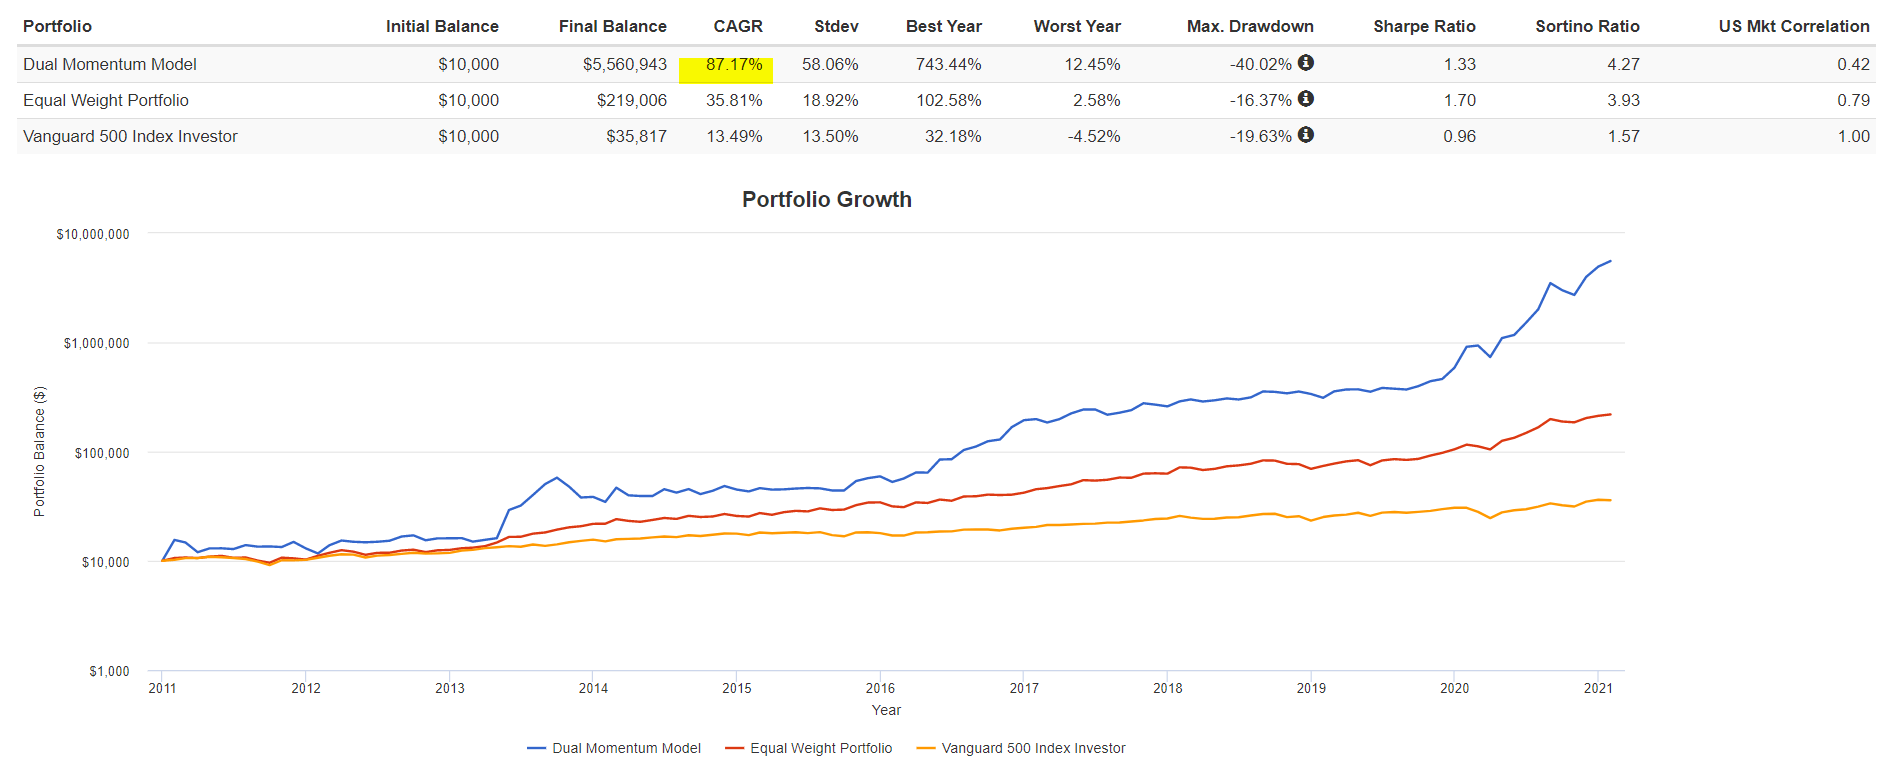
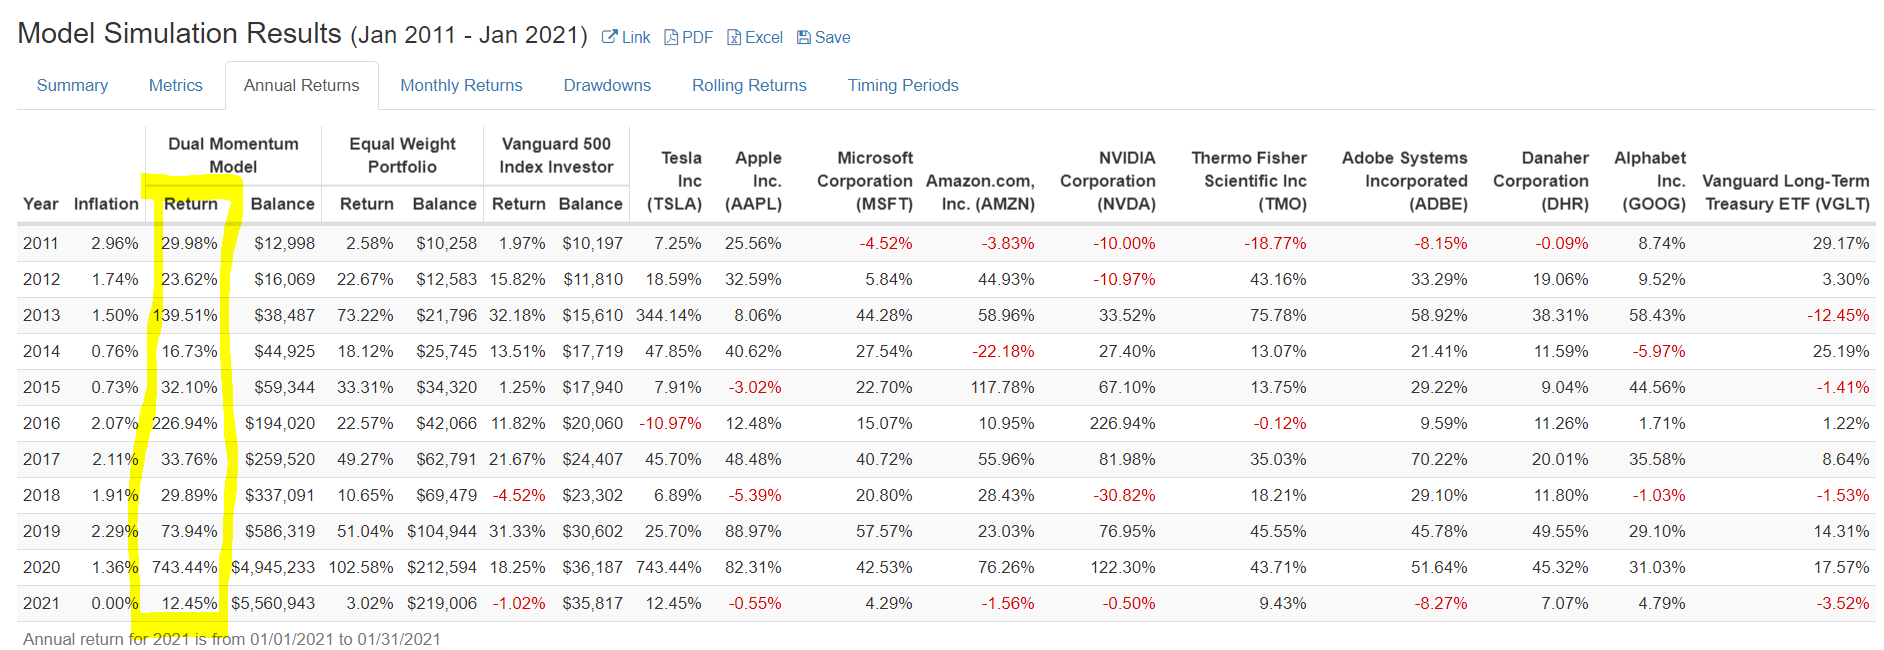
把MTUM持股的前十名(不含PYPL, 因為可回測時間太短, 先拉掉)丟到冠軍策略裡面, 持股數設1, 可以看到如下的鬼神表現, 不過我覺這樣有點後照鏡, 誰都知道最近幾年FANG+強得跟鬼一樣, 特別是Tesla, 2020年一年漲了700%, 所以再進行實驗二, 用XMMO的表現也一樣嗎?

TSLA AAPL MSFT AMZN NVDA TMO ADBE DHR GOOG

Dual Mornentum Model 
Equal Wetght Portfolio 
Vanguard 500 Index Investor 
5100.000 
SIO,ooo 
sl.ooo 
2012 
Initial 
$10,000 
$10,000 
$10,000 
2013 
Final Balance 
$219,006 
$35,817 
— Dual Model 
CAGR 
87.17% 
3581% 
13.49% 
Stdev 
5806% 
1892% 
13.50% 
Best Year 
74344% 
10258% 
3218% 
Worst Year 
12.45% 
2017 
Max. Drawdown 
-40 o 
-1637% 
-1963% 
2019 
1.33 
1.70 
Sortino Ratio 
1.57 
US Mkt Correlation 
042 
079 
Portfolio Growth 
2015 
2016 
— Equal Weight Portfolio 
— Vanguard 500 Investor
Model Simulation Results (Jan 2011 - Jan 2021) C?Link EPDF RExcel ıssave 
Sumrnaıy 
Metncs Annual Returns Monthly Returns 
Rolling Returns TırnilW Periods 
Dual Momentum 
Equal Weiaht 
Portfolio 
Vanauard 500 
Index Investor 
Year 
2011 
2012 
2013 
2014 
2015 
2016 
2017 
2018 
2019 
2020 
2021 
Inflation 
1.14% 
1.50% 
0.73% 
207% 
211% 
ı.gı% 
229* 
0.00% 
Return 
2998% 
2362% 
13951% 
1673% 
3210% 
22644% 
3376% 
29B9% 
7394% 
74344% 
1245% 
Balance 
S12,998 
616,069 
638,487 
644,925 
$194,020 
6259,520 
6331,091 
6586,319 
Return 
2.58% 
22.67% 
7322% 
18.12% 
33.31% 
22.57% 
4927% 
10.65% 
51.04% 
102.58% 
3.02% 
Balance 
Sıo,258 
S12,583 
621,796 
625,745 
642,066 
$ 104,944 
6212,594 
6219,006 
Return 
1.97% 
32.18% 
13.51% 
125% 
-4.52% 
-1.02% 
Balance 
Sıo,191 
Sıı,810 
S15,610 
S17,719 
S17,94Û 
520,060 
524,407 
523,302 
530,602 
536.187 
535,817 
Tesla 
(TSLA) 
344 _ 
7.91% 
-10.97% 
45.70% 
Apple 
Inc, 
(AAPL) 
2556% 
3259% 
806% 
4062% 
-302% 
1248% 
4848% 
-539% 
8897% 
8231% 
-055% 
Corporation 
(MSFT) 
5.84% 
4428% 
27.54% 
22.709 
1507% 
40.72% 
20.80% 
57.57% 
42.53% 
429% 
Amazon.com, 
Inc, (AMZN) 
-22.18% 
117.78% 
NVIDIA 
Corporation 
(NVDA) 
-10.00% 
-10.97% 
33.52% 
27.409 
67.109 
226.94% 
81.98% 
-30.82% 
76.95% 
-0.50% 
Thermo Fisher 
Scientific Inc 
(TMO) 
-1871% 
4316% 
7578% 
1307% 
1375% 
-012% 
3503% 
1821% 
4555% 
4371% 
943% 
Adobe SystemS 
Incorporated 
(ADBE) 
-8.15% 
3329% 
21.41% 
2922% 
9.599 
7022% 
29.109 
45.78% 
51.64% 
-8.27% 
Danaher 
Corporation 
(OHRİ 
-009% 
1906% 
3831% 
1159% 
904 % 
1126% 
2001% 
11 
4955% 
4532% 
Alpha bet 
Inc, 
(GOOG) 
58.43% 
-5.97% 
ı.Tı% 
2910% 
Vanguard Long-Term 
Treasury ETF (VGLT) 
29.17% 
3.30% 
-12.45% 
25.199 
-1.41% 
122% 
B.64% 
-1.53% 
17.57% 
-3.52% 
Annuaı return tor 2021 is 'rom 01/0112021 01/31,2021
這個年報酬真的很殺, 光Tesla一支就夠本了.

1

實驗二: XMMO+冠軍策略(股票數10, 持股1, 出場持有VGLT, 一個月看一次不使用單一絕對動能)

把XMMO的前十名持股放進冠軍策略, 一樣持股數設1, 看到的是與MTUM前十名完全不同的光景, 拉回變得很大, 績效還不如平均持股, 由於XMMO是比較新的ETF, 資料只有到2016.

很顯然這個系統在持股單一的狀況下, 會受到個股表現影響而有很大的波動, 甚至會不如平均配置.

GNRC SEDG MPWR SAM MASI CGNX QDEL CRL TECH CABO

portfolio 
Dual Momentum Model 
Equal Weight Portfolio 
Vanguard 500 Index I nvestor 
550.000 
S2-o.oco 
50.000 
Jan 2016 
Initial Balance 
$10,000 
$10,000 
$10,000 
Final Balance 
$34,079 
$72,837 
$19,965 
Jul 2017 
— Dual Momentum Model 
27.28% 
47.79% 
14.57% 
49.69% 
19.69% 
15.17% 
St Yea r 
75.80% 
112.32% 
31.33% 
Worst Year 
211% 
452% 
2019 
'e 2019 
Max. Drawdown 
_49.66% O 
-18.28% O 
-19.63% O 
Jan 2020 
Ratio 
071 
205 
Jul 2020 
o Rae o 
1.19 
5.25 
2021 
LIS Mkt Correlation 
Jul 2016 
Portfolio Growth 
JL. 2018 
— Equal weignt Ponrol'o 
— Vanguard 500 Index Investor

1

實驗三: MTUM+冠軍策略(股票數9, 持股4, 出場持有VGLT, 一個月看一次,不使用單一絕對動能)

那….試著把持股變成群組, 改成4試試, 一整組的績效應該要比較平滑一點.

如下圖, 從2011年起, 年化40.85%, 最大拉回-21.94%, 和實驗一相比, 績效有比較低, 不過拉回也平穩得多.

MTUM:TSLA AAPL MSFT AMZN NVDA TMO ADBE DHR GOOG

年報酬這樣很可以.

1

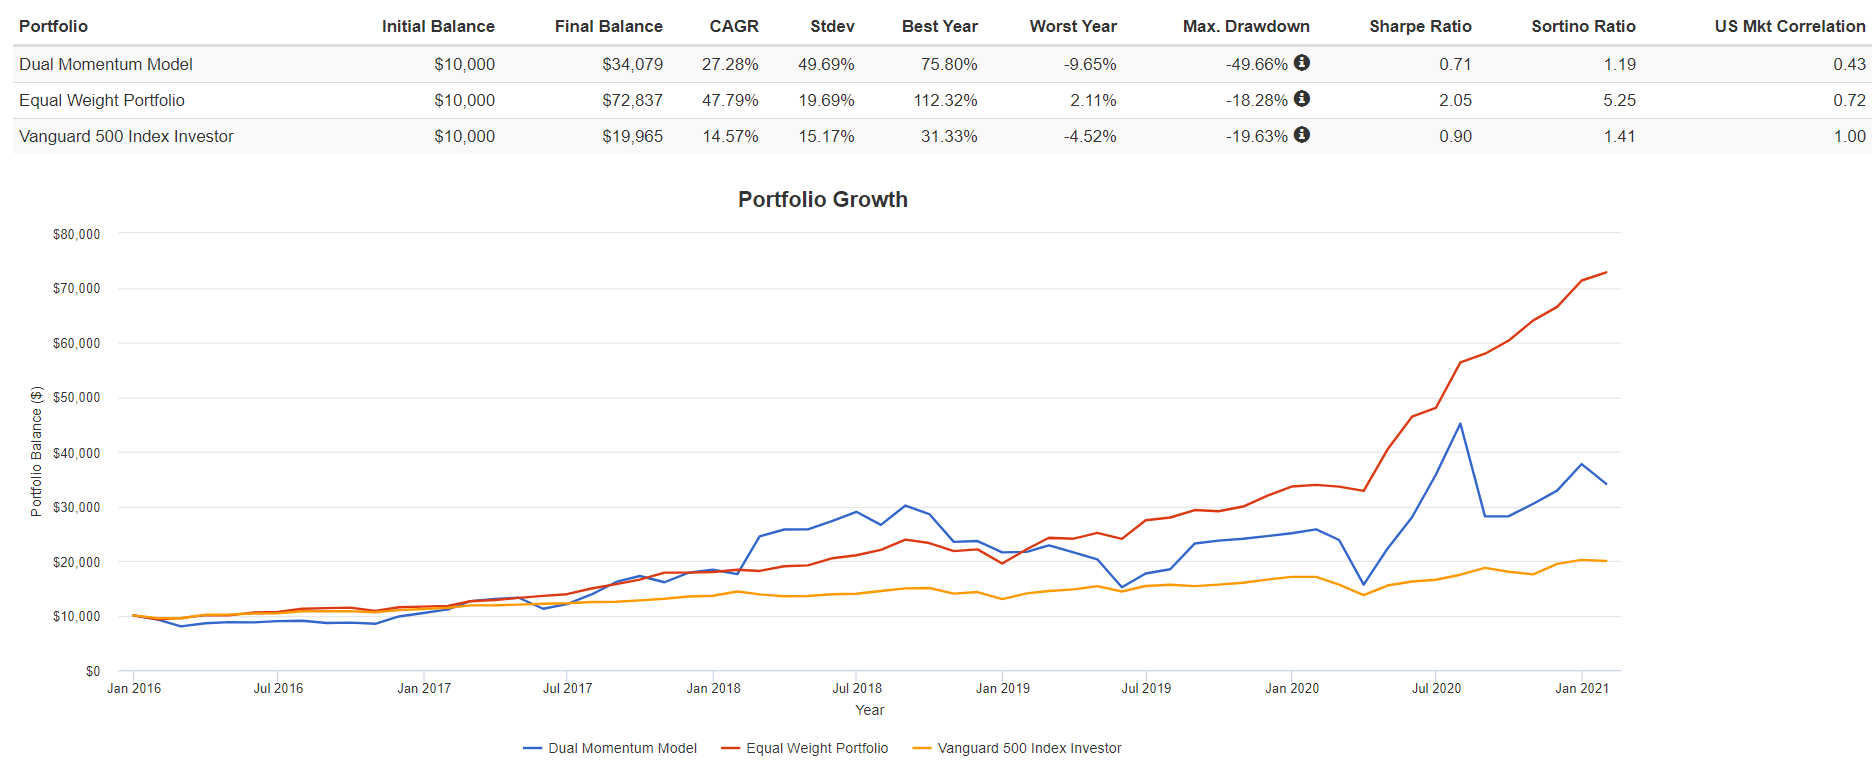
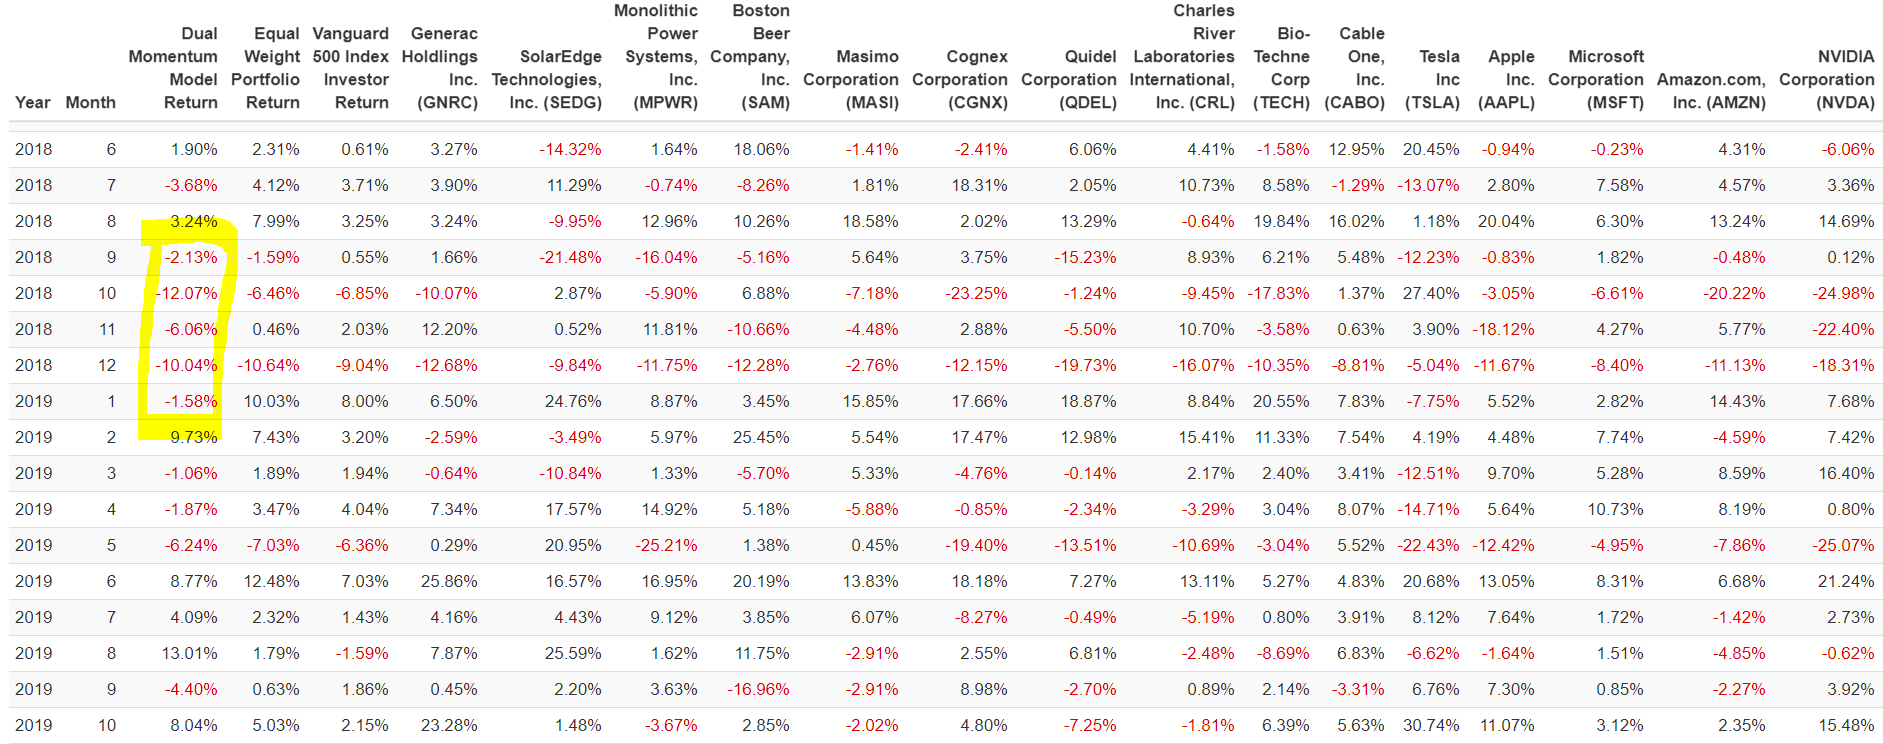
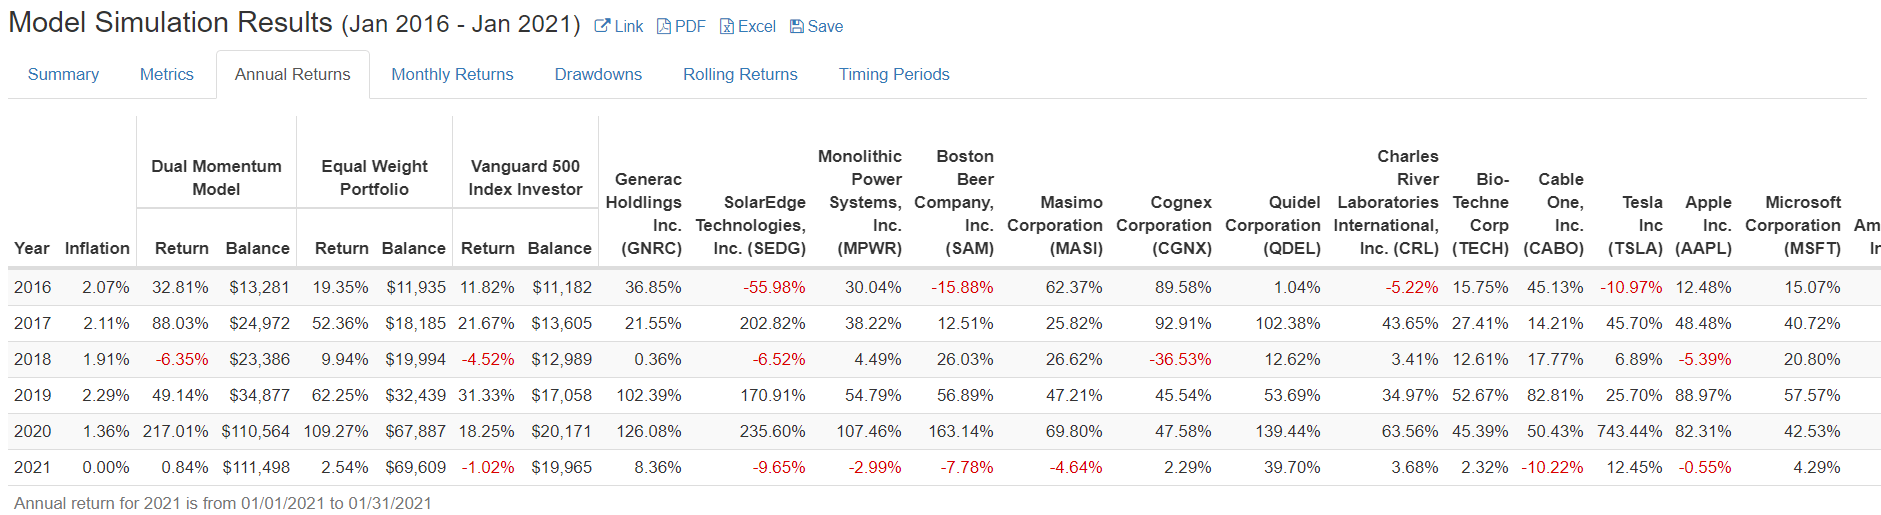
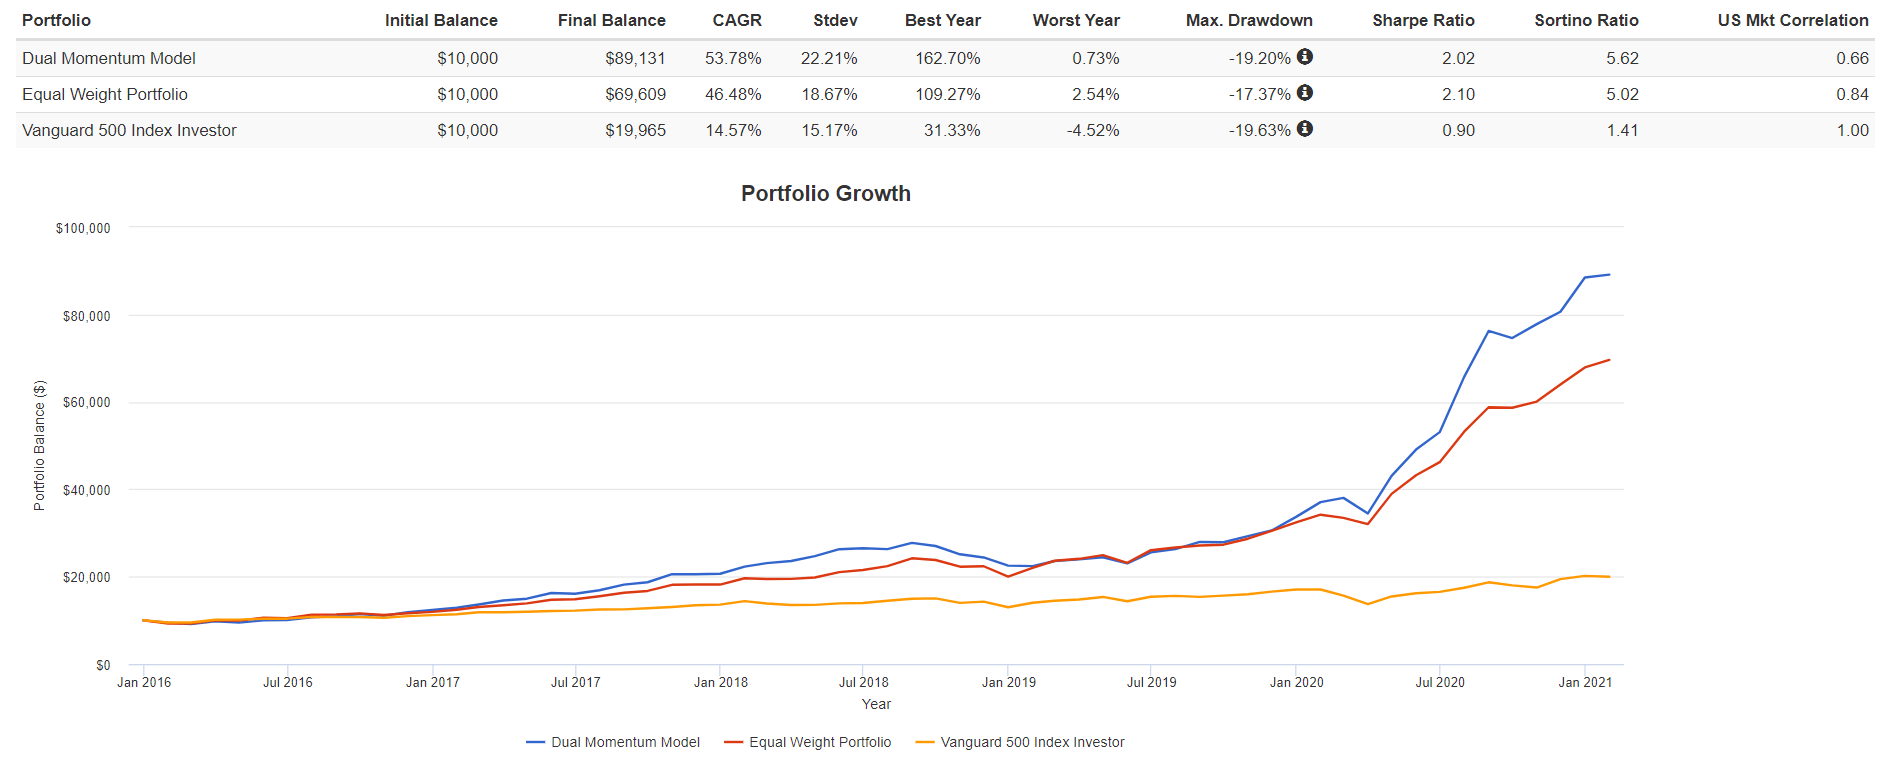
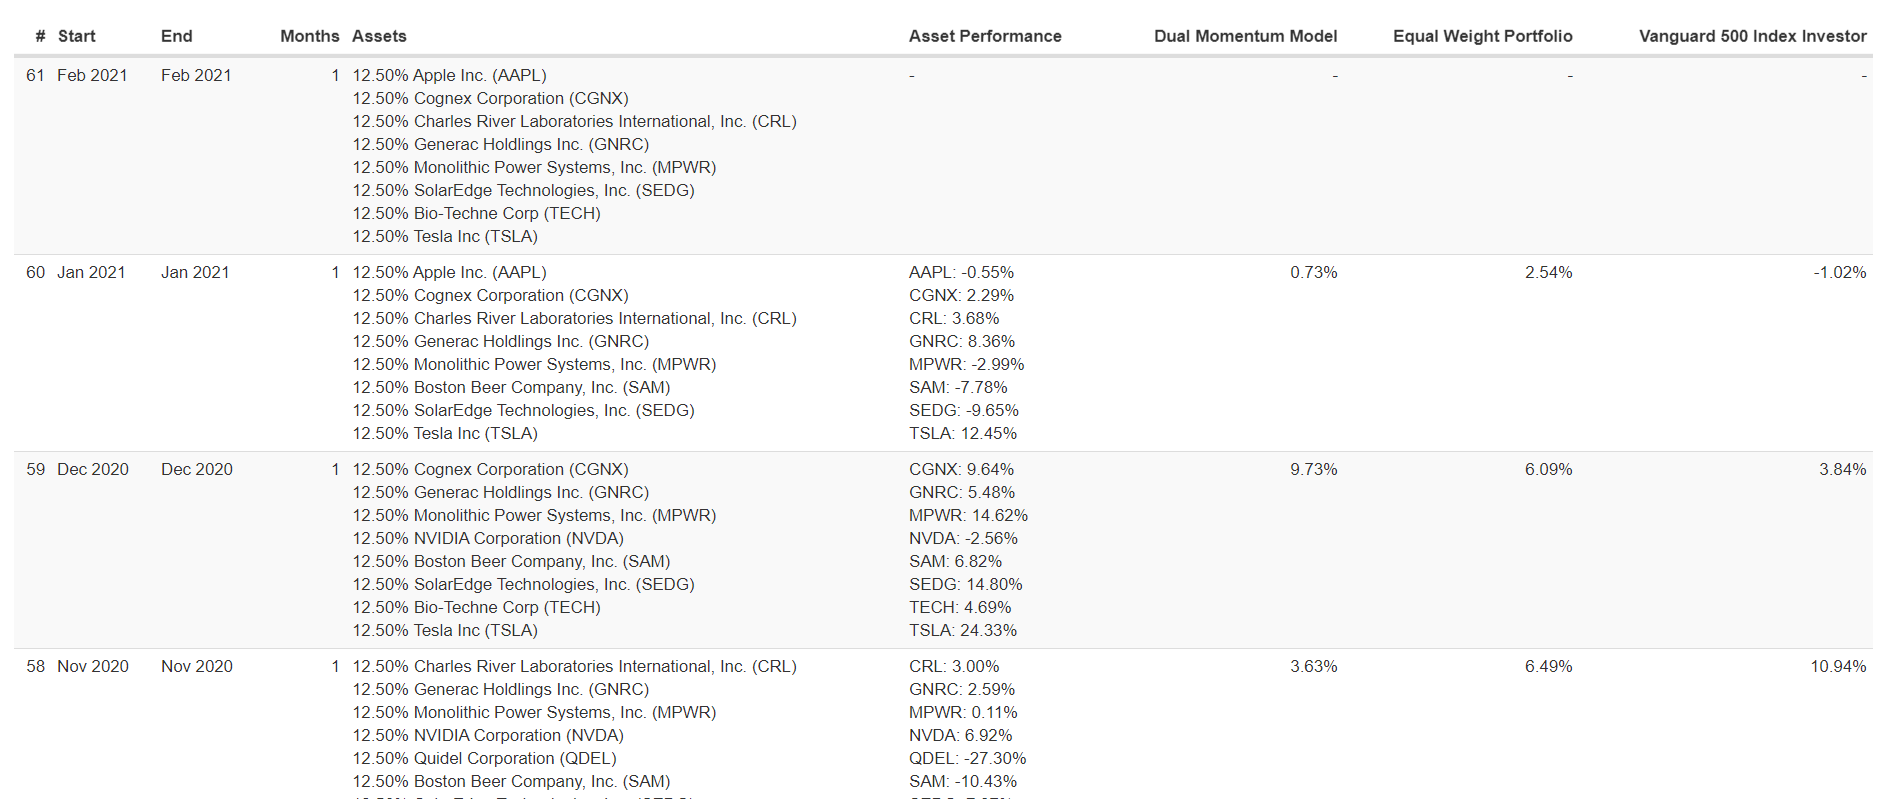
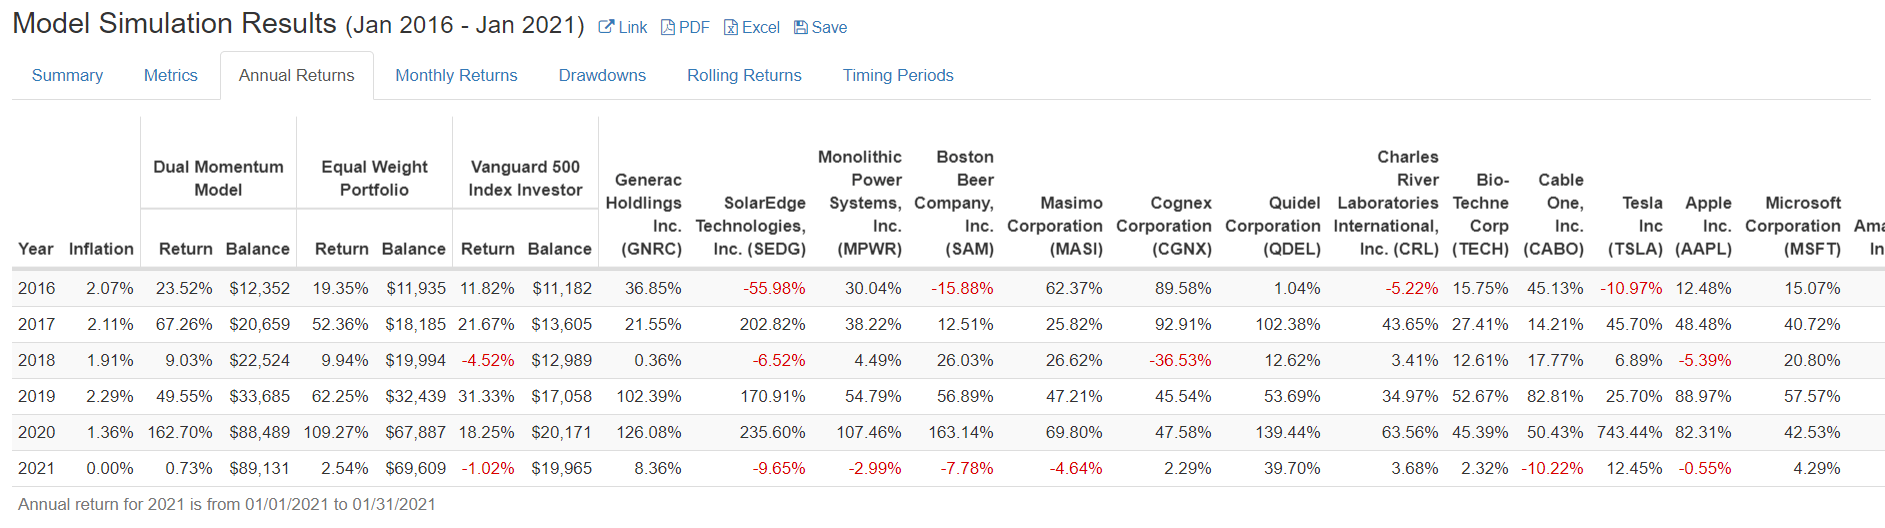
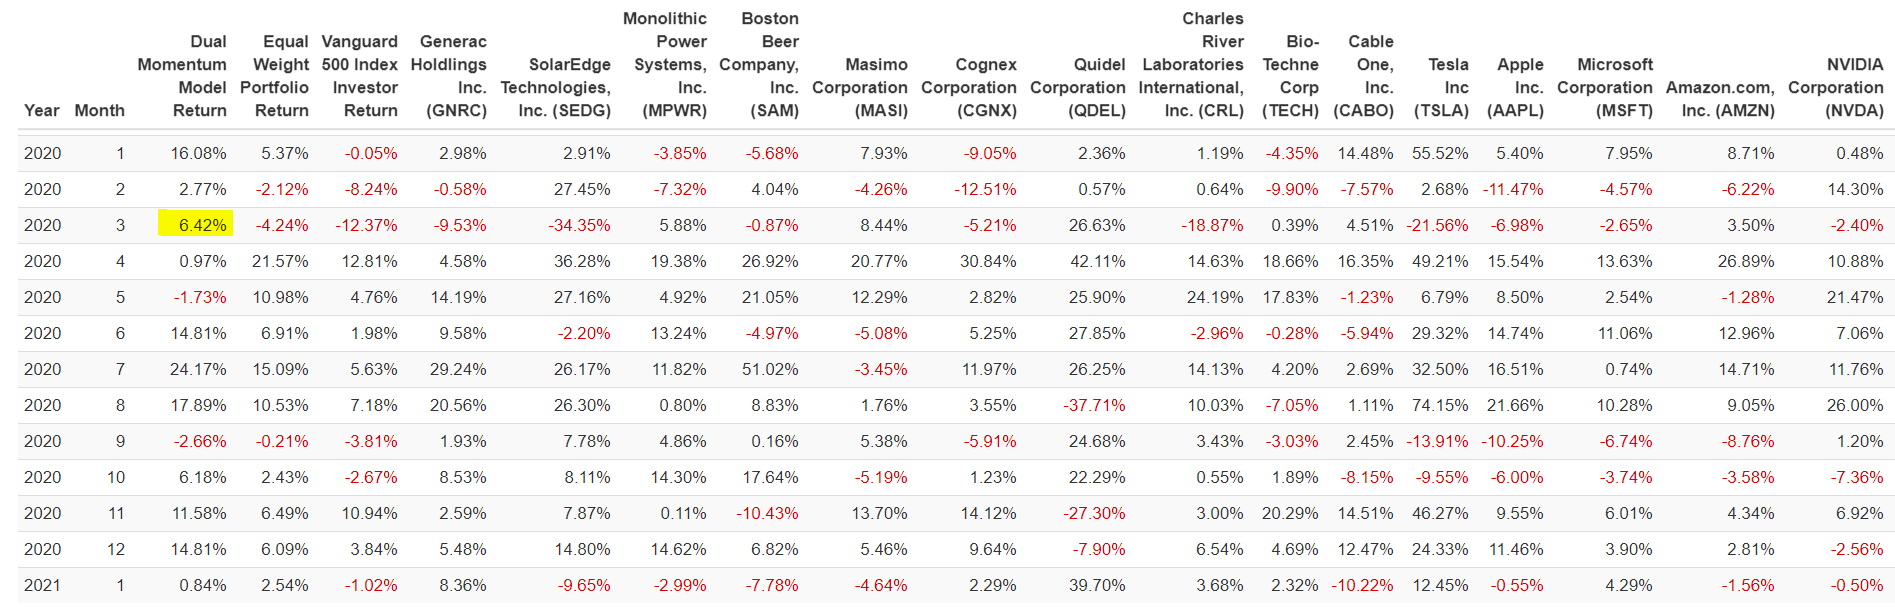
實驗四: XMMO+冠軍策略(股票數10, 持股4, 出場持有VGLT, 一個月看一次,不使用單一絕對動能)

XMMO的實驗顯示出類似的結果, 拉回變得比實驗二的-49.66%平穩許多, 年化報酬也從27.28%來到49.79%, 整體結果和平均持股(Equal weight Portfolio)是接近的.

XMMO: GNRC SEDG MPWR SAM MASI CGNX QDEL CRL TECH CABO

Portfolio 
Dual Momentum Model 
Equal Weight portfolio 
Vanguard 500 Index Investor 
$100,000 
so. 000 
S60,ooo 
"0.000 
S20.ooo 
2016 
Jul 2016 
Initial Balance 
$10,000 
Jan 2017 
Final Balance 
$77.99g 
$72,837 
$19,965 
Jul 2017 
CAGR 
49, 
4779% 
1457% 
2487% 
1517% 
Best Year 
14923% 
11232% 
3103% 
Worst Year 
-3.02% 
4.52% 
Jan 2019 
Max. Drawdown 
-21.53% O 
-18128% O 
-1963% o 
Jan 2020 
Sharpe Ratio 
Jul 2020 
Sortino Ratio 
4.69 
5.25 
1.41 
2021 
US Wt Correlation 
0,43 
o, 72 
1,00 
portfolio Growth 
Jan 2018 
Jul 2018 
Jul 2019
Model Simulation Results (Jan 2016 -Jan 2021) esave 
Summary Metrics Annual Returns Monthly Returns 
Drawdowns 
Rolling Returns Timing Periods 
Dual Momentum 
Equal Weight 
Portfolio 
Year Inflation 
Vanguard 500 
Index Investor 
Bal 
2016 
2017 
2018 
2019 
2020 
2021 
207% 
2M1% 
1.91% 
229% 
1.36% 
0.00% 
Return 
1066% 
82 
699% 
49.67% 
149.23% 
-302% 
Bal 
S11.056 
$20.151 
$21,560 
532.269 
$80,424 
$77999 
Re turn 
5464% 
8.71% 
7M7% 
11202% 
$11 ,616 
$17,951 
$19,514 
$33,598 
$71,335 
1182% 
2167% 
4.52 % 
3103% 
18.25% 
-102% 
$11,182 
$13.605 
$12,989 
$17,058 
$20,171 
$19,965 
Gene rac 
HOI dl ings 
Inc. (GNRC) 
21 
102.39% 
126.08% 
SolarEdge 
Technologies, 
Inc. (SEDG) 
-5598% 
20282% 
_6.52% 
170.91% 
235.60% 
Power 
Systems, Inc. 
(MPWR) 
3004% 
3822% 
4.49% 
54.79% 
107.46% 
Boston Beer 
Company, 
Inc. (SAM) 
-1588% 
1251% 
2603% 
163.14% 
-7.78% 
Ma simo 
Corporation 
(MASI) 
62.37% 
25.82% 
26.62% 
47.21% 
_464% 
Cognex 
Corporation 
(CGNX) 
8968% 
9291% 
-3653% 
4564% 
47.58% 
2.29% 
Qui del 
Corporation 
(QOEL) 
10238% 
12.62% 
139.44% 
39.70% 
Charles River 
Laboratories 
International, Inc. 
(CRL) 
-522% 
4365% 
3.41% 
34.97% 
6356% 
368% 
Bio- 
Techne 
Corp 
(TECH) 
15.75% 
27 I % 
12.61% 
52.67% 
4509% 
2.32% 
Cable 
One, 
Inc. 
(CABO) 
45.13% 
1421% 
1777% 
8281% 
50.43% 
-1022% 
Vanguard 
Long •Term 
Treasury ETF 
(VGLT) 
122% 
8.64% 
-1.53% 
1431% 
1767% 
-382% 
Annual return for 2021 is 01/01/2021 to 01/31/2021

1

實驗五: XMMO前5名+MTUM前5名+冠軍策略(股票數10, 持股4, 出場持有VGLT, 一個月看一次,不使用單一絕對動能)

那麼, 如果今天大型股威風不再, 輪到中型股當家了呢? 或者反過來, 只用大型股或只用中型股的策略不就吃虧了?

我們試著把二支ETF的前五大持股放在一起實驗, 看能不能兼顧到大中型股.

MTUM 前5名+XMMO前5名, 持股4支: TSLA AAPL MSFT NVDA TMO GNRC SEDG MPWR SAM MASI

結果看起來滿殺的, 波動也不會太誇張,

Portfolio 
Dual Momentum Model 
equal weight portf01i0 
Vanguard 500 Index Investor 
Sloo.ooo 
S30,coo 
.coo 
,coo 
,coo 
SIO.ooo 
Jan 2016 
Jul 2016 
Initial Balance 
$10,000 
$10,000 
$10,000 
Jan 2017 
Final Balance 
$117,264 
$89,627 
$19,065 
Jul 2017 
CAGR 
62.30% 
53.94% 
14.57% 
Stdev 
27 
2130% 
15.17% 
Best Year 
241 87% 
152 
31 33% 
Worst Year 
_940% 
084% 
-462% 
Jan 2019 
Max. Drawdown 
-24.72% o 
o 
-1776% 
o 
-19.63% 
Jan 2020 
Sharpe Ratio 
1,87 
2.10 
080 
Jul 2020 
Sortino Ratio 
4, 93 
5.71 
141 
Jan 2021 
US Mkt Correlation 
0.59 
0 78 
1.00 
Portfolio Growth 
Jan 2018 
Jul 2018 
Year 
— Equal Weight Portfolio 
Jul 2019 
— Dual Momentum Model 
— Vanguard 500 Index Investor

2018和2020年初的拉回, 要有大幅震盪的心理準備, 如果在資產配置裡只放個10%, 其實也不會很痛.

PORTFOLİO VİSUALIZER 
Duaı Equaı wejght 
Year 
2018 
2018 
2018 
2018 
2019 
2019 
2019 
2019 
2019 
2019 
2019 
2019 
2019 
2019 
2019 
2019 
2020 
2020 
2020 
Month 
10 
11 
12 
2 
3 
4 
5 
6 
7 
8 
9 
10 
11 
12 
2 
3 
Momentum 
Model Return 
-2 4996 
_9 _ 100/6 
3_42% 
-3.25% 
-2,6796 
2.64% 
11 
16.08% 
-16.96% 
Portfolio 
Retum 
-10.30% 
424% 
_664% 
vanguard 500 
Index Investor 
Return 
_6.8596 
1.86% 
3,6296 
00596 
-resıa 
Inc 
(TSLA) 
-1223% 
27 
39096 
-775% 
4.19% 
-1251% 
-1471% 
-72 
20.68% 
.6.62% 
47796 
2.6896 
-21 
Apple 
Inc- 
(AAPL) 
-305% 
-18.12% 
4.48 % 
g.70% 
-12.42% 
13.05% 
7 x34% 
730% 
11.01% 
775% 
g.88% 
5.40% 
_6.98% 
Microsoft 
Corporation 
(MSFT) 
1.82% 
_6ffi1% 
4.27% 
-8 4096 
7.14% 
5.28% 
10.13% 
_4.9596 
8.31% 
172% 
1.51% 
3.12% 
4.17% 
795% 
-4.57% 
-Th5% 
NVIDIA 
Corporation 
(NVDA) 
-74 989/0 
-224096 
-18 
1640% 
OBO% 
-75 
21 
.0.62% 
15.48% 
7.90% 
8.56% 
14.30% 
Thermo Fisher 
Scİentİfic Inc 
(TMO) 
2.15% 
6.81% 
-10 
g.78% 
5 66% 
5.53% 
10.07% 
3.38% 
3.68% 
3.96% 
3.54% 
-3.60% 
Generac 
Holdlings Inc, 
(GNRC) 
-10 
122096 
-12 
6.5096 
-2.59% 
-0.64% 
7.34% 
0.29% 
25.86% 
4M6% 
23.28% 
2.1296 
-0.58% 
Exampıes 
SoıarEdge 
Technologies, 
Inc. (SEDG) 
2.87% 
0.52% 
_9 84 % 
24.76% 
-3.49% 
-IOR4% 
17.57% 
20VJ% 
16.57% 
4430/0 
25.50% 
16.52% 
2.91% 
27.45% 
_34.350/0 
FAQ contact 
Monolithic Power 
Systems, Inc- 
(MPWR) 
11.81% 
-11.15% 
14 9296 
-25.21% 
1.62% 
3ffi3% 
7M8% 
-3.85% 
5.88% 
Boston Beer 
Company, Inc. 
(SAM) 
-5.16% 
-10E6% 
-12 
3.45% 
25.45% 
-570% 
5.18% 
20.19% 
11 .75% 
-16.96% 
2.85% 
-5.68% 
4.04% 
e My Models 
Masimo 
Corporation 
(MAŞI) 
5.64% 
-7M8% 
-4 4896 
15.85% 
5.54% 
5.33% 
-588% 
045% 
13.83% 
.291% 
-2.91% 
7.93% 
-4 2696 
Yen-peng • 
Vanguard Long- 
Term Treasury ETE 
(VGLT) 
-2.85% 
-1_92% 
-25796 
-013896 
1.29% 
642%
Model Simulation Results (Jan 2016 - Jan 2021) 
Summary 
Metncs Annual Returns Monthly Returns 
Drawdowns 
Rolling Returns T•rnirW Periods 
Dual Momentum 
Equal Weight 
Portfolio 
Vanguard 500 
Index Investor 
Year 
2016 
2017 
2018 
2019 
2020 
2021 
Inflation 
2.07% 
211% 
181% 
229% 
0.00% 
Re tum 
3322% 
6532% 
70.46% 
24187% 
084% 
Balance 
S13,322 
S22.024 
$19,954 
$34,013 
$116,282 
$117,264 
Retum 
1909% 
53 
10.11% 
75 
15207% 
Balance 
sli,gog 
S13,236 
$35,260 
$88,879 
$89,627 
Re tum 
1182% 
2167% 
31 
1825% 
-102% 
Balance 
$11,182 
$13,605 
$12,989 
$17.05d 
$20.171 
$19,965 
Inc 
(TSA) 
-1097% 
4570% 
689% 
25.70% 
1245% 
Apple 
Inc. 
(AAPL) 
1248% 
4848% 
38.97% 
82.31% 
-055% 
Microsoft 
Corporation 
(MSFT) 
15.07% 
40.72% 
20.80% 
57S7% 
42.53% 
429% 
NVIDIA 
Corporation 
(NVDA) 
22694% 
3198% 
12230% 
-050% 
Fisher 
Scientific Inc 
(TMO) 
-0.12% 
1821% 
45 
43.71% 
9.43% 
Gene rac 
Holdlings 
Inc. (GNRC) 
3685% 
2155% 
102.39% 
12608% 
8.36% 
Technologies, 
Inc. (SEDG) 
-5598% 
20282% 
170.91% 
23560% 
Monolithic 
Power Systems, 
Inc. (MPWR) 
3004% 
107 
Boston r 
Company, 
Inc. (SAM) 
-1588% 
12.51% 
26.03% 
5689% 
16314% 
-778% 
Masimo 
Corporation 
(MAS') 
6237% 
2582% 
2662% 
4721% 
6980% 
464% 
Vanguard Long- 
Term Treasury 
ETF (VGLT) 
122% 
8.64% 
-1S3% 
1401% 
1767% 
-3.52% 
Annual return for 2021 is trom 01/012021 to

持股內容看起來滿平衡的, 每個月抱4支, 也不會很難換.

Dual 
57 
56 
55 
54 
53 
52 
51 
Start 
Feb 2021 
Jan 2021 
Dec 2020 
oct 2020 
sep 2020 
Aug 2020 
Jul 2020 
End 
Feb 2021 
Jan 2021 
Dec 2020 
NOV 2020 
sep 2020 
Aug 2020 
Jul 2020 
Month s 
2 
Assets 
Apple Inc. (A.APL) 
Generac HOIdljngs Inc. (GNRC) 
25 SolarEdge Technologies, Inc. (SEDG) 
Tesla Inc (TSLA) 
Generac HOIdlings Inc. (GNRC) 
Boston Beer Company, (SAM) 
solarE-dge Technologies, Inc. (SEDG) 
Tesla Inc (TSLA) 
2500% Generac Holdlings Inc. (GNRC) 
2500% MonolithiC power Systems, Ina (MPWR) 
soar€ge Technologies, Inc. (SEDG) 
Tesla Inc (TSLA) 
Generac HOIdlings Inc. (GNRC) 
Boston Beer Company, Inc. (SAM) 
SolarEdge Technologies, Inc. (SEDG) 
2500% Tesla Inc (TSLA) 
Generac HOIdlings Inc. (GNRC) 
25.00% NVIDIA Corporation (NVDA) 
25,00% Boston Beer Company, Inc. (SAM) 
Tesla Inc (TSLA) 
2500% Generac Holdlings Inc. (GNRC) 
2500% Boston Beer Company, Inc., (SAM) 
solare-dge Technologies, Inc. (SEDG) 
2500% Tesla Inc (TSLA) 
25.00% Monolithic Power Systems, Inc. (MPWR) 
NVIDIA Corporation (NVDA) 
SolarEdge Technologies, Inc. (SEDG) 
Tesla Inc (TSLA) 
Asset Performance 
GNRC: 8.36% 
SAM- -778% 
SEDGI -g 65% 
TSLA: 
CNRCI 5.48% 
MPWR 14 
SEDGI 
TSLA: 
GNRC: 11 „34% 
SAMI 
SEDG: 1663% 
TSLA. 32.30% 
GNRCI 183% 
NVDA: 
SAM 
TSLA: 
CNRC: 20 56% 
SAM 
SEDGI 
TSLA: 
MPVVR 1182% 
NVDA 
SEDC: 
TSUA 32 
Momentum Model 
0.84% 
1481% 
-2.66% 
32.46% 
Equal Weight Portfolio 
084% 
845% 
1067% 
066% 
19.05% 
Vanguard 500 Index Investor 
384% 
7,97% 
-381% 
7.18% 
5.63%

1

實驗六: XMMO前10名+MTUM前10名+冠軍策略(股票數19, 持股4, 出場持有VGLT, 一個月看一次,不使用單一絕對動能)

結果跟實驗五差不多.

GNRC SEDG MPWR SAM MASI CGNX QDEL CRL TECH CABO TSLA AAPL MSFT AMZN NVDA TMO ADBE DHR GOOG

PO MONO 
Duel Momentum Model 
Equal Weight Portfolio 
Vanguard 500 IMex Investor 
S200,ooo 
SIOO,OOO 
SB0,ooo 
S40,ooo 
20,000 
se.ooo 
S6.ooo 
Jan 2016 
SIO,ooo 
SIO.OOO 
SIO,ooo 
Jan 
Final Balance 
$111,498 
S6g.60g 
Sig,965 
Jul 201' 
CAGR 
6070% 
4648% 
14.57% 
28.63% 
1867% 
15.17% 
Be St Year 
217.01% 
10927% 
31.33% 
Worst Year 
2.54% 
Jan 2019 
Max. Drawdown 
-201% O 
-1707% O 
-1963% O 
Sharpe Ratio 
178 
210 
2020 
Sortino o 
4.15 
5.02 
Jan 2021 
US Mkt Correlation 
Jul 20 '6 
Portfolio Growth 
Jan 2018 
Jul 2018 
— Equal Weight portfolio 
2019 
— Dual Momentum Model 
— Vanguara SOO Index Investor

拉回的時候對心性是大考驗.

Dual 
Momen tu m 
, Company, 
Year 
2018 
2018 
2018 
2018 
2018 
2018 
2018 
2019 
2019 
2019 
2019 
2019 
2019 
2019 
2019 
2019 
2019 
Mon th 
Model 
Retum 
1.90% 
-368% 
3.24% 
-2M3% 
-6.06% 
-106% 
_6.24% 
4.09% 
13.01% 
4.40% 
8.04% 
Equal 
Portfolio 
Retum 
231% 
_646% 
-1064% 
347% 
179% 
5,03% 
Vanguard 
500 Index 
Investor 
Retum 
0.61% 
3.25% 
0.55% 
2.03% 
8.00% 
320% 
1.94% 
-6.36% 
703% 
143% 
186% 
2.15% 
Generac 
Holdlings 
Inca 
(GNRC) 
3,24% 
-1268% 
-2sg% 
704% 
707% 
23,28% 
Sola 
Technologies, 
Inc. (SEDG) 
1129% 
_g.95% 
-2148% 
2.87% 
0.52% 
2476% 
17.57% 
20.95% 
16.57% 
4.43% 
2559% 
148% 
Monolithic 
(MPWR) 
_0.74% 
12.96% 
1181% 
-11 
887% 
5.97% 
133% 
14,92% 
-2521% 
16.95% 
9.12% 
162% 
363% 
Boston 
Inc. 
(SAM) 
-1228% 
3.45% 
5,18% 
1.38% 
20, 
3.85% 
11,75% 
285% 
Corpora ti on 
(MAS') 
-141% 
181% 
564% 
-276% 
15.85% 
5,54% 
0.45% 
607% 
-2,91% 
Corpo raton 
(CGNX) 
-241% 
18.31% 
375% 
-2325% 
-1215% 
1766% 
1747% 
_476% 
-085% 
-1940% 
18.18% 
Quidel 
Corporation 
(QOEL) 
205% 
-15.23% 
-19.73% 
18.87% 
1298% 
-234% 
-13.51% 
7,27% 
0.49% 
-270% 
-725% 
International , 
Inc. (CRL) 
10.73% 
8.93% 
10.70% 
1311% 
0.89% 
-181% 
Bio- 
Corp 
(TECH) 
8.58% 
6,21% 
-1783% 
11 
2.40% 
5,27% 
0.80% 
6.39% 
Cable 
Inc. 
(CABO) 
12,95% 
-129% 
1,37% 
754% 
3,41% 
5,52% 
4,83% 
Inc 
(TSLA) 
20,45% 
IMB% 
-12,23% 
27 
-775% 
-12,51% 
-1471% 
-22,43% 
3074% 
Inc. 
(AAPL) 
-18'2% 
-1167% 
5,52% 
-164% 
7.30% 
1107% 
Corporaton 
(MSFT) 
-023% 
788% 
182% 
427% 
774% 
528% 
1073% 
485% 
172% 
Amazon.com, 
Inc. (AMZN) 
4,57% 
13,24% 
_048% 
-2022% 
-11'3% 
-142% 
-2,27% 
NVIDIA 
Corporaton 
(NVDA) 
1469% 
-2498% 
-2240% 
-1831% 
768% 
742% 
2124% 
2,73%
Model Simulation Results (Jan 2016 - Jan 2021) 
Summary 
Metrics Annual Returns Monthly Returns 
Drawdowns 
ESave 
Rolling Returns 
Periods 
Momentum 
Equal Weight 
Portfolio 
Vanguard 500 
Generac 
Index Investor 
Year 
2016 
2017 
2018 
2019 
2020 
2021 
Inflation 
2.07% 
211% 
1.91% 
220% 
136% 
0.00% 
Re tum 
3281% 
8803% 
-635% 
4014% 
21701% 
084% 
Balance 
S13,281 
s24,g72 
93,386 
S34,877 
Silo,564 
$111,498 
Retum 
19.35% 
52.36% 
9.94% 
62.25% 
109.27% 
2.54% 
Balance 
sli,g35 
S18,185 
S19,g94 
92,439 
S67,887 
S69,609 
Re tum 
1182% 
2167% 
452% 
3133% 
1825% 
.102% 
Balance 
$11,182 
$13,605 
$12,989 
S171058 
S201171 
Sig1965 
Holdlings 
Inc. 
(GNRC) 
36.85% 
2185% 
102.30% 
126.08% 
dge 
Technologies, 
Inc. (SEDG) 
-5598% 
20282% 
-652% 
17091% 
23560% 
.065% 
Monolithic 
(MPWR) 
3004% 
3822% 
5479% 
10746% 
.299% 
Boston 
Inc. 
(SAM) 
-1588% 
12.51% 
26.03% 
56.80% 
163.14% 
m78% 
Masimo 
Corporation 
(MAS') 
6237% 
2582% 
2662% 
4721% 
6080% 
464% 
Cog 
Corporation 
(CGNX) 
92.91% 
45.54% 
47.58% 
Qui del 
Corporation 
(QDEL) 
104% 
102.38% 
12.62% 
53.60% 
139.44% 
39.70% 
Charles 
River 
Laboratories 
Intemati on al, 
Inc. (CRL) 
-522% 
4365% 
341% 
3497% 
6356% 
368% 
Bio- 
Tech 
Corp 
(TECH) 
15.75% 
2741% 
12.61% 
52.67% 
45.39% 
2.32% 
cable 
(CABO) 
45.13% 
1421% 
17.77% 
82.81% 
50 _ 
Tesla 
(TSLA) 
-1097% 
45.70% 
6.80% 
25.70% 
74344% 
12.45% 
Apple 
Inc. 
(AAPL) 
12.48% 
48.48% 
-5.39% 
88.97% 
82.31% 
.0.55% 
Corporation Am 
(MSFT) Ir 
1507% 
4072% 
2080% 
5787% 
4253% 
429% 
Annual return for 2021 is from 01/012021 to

1

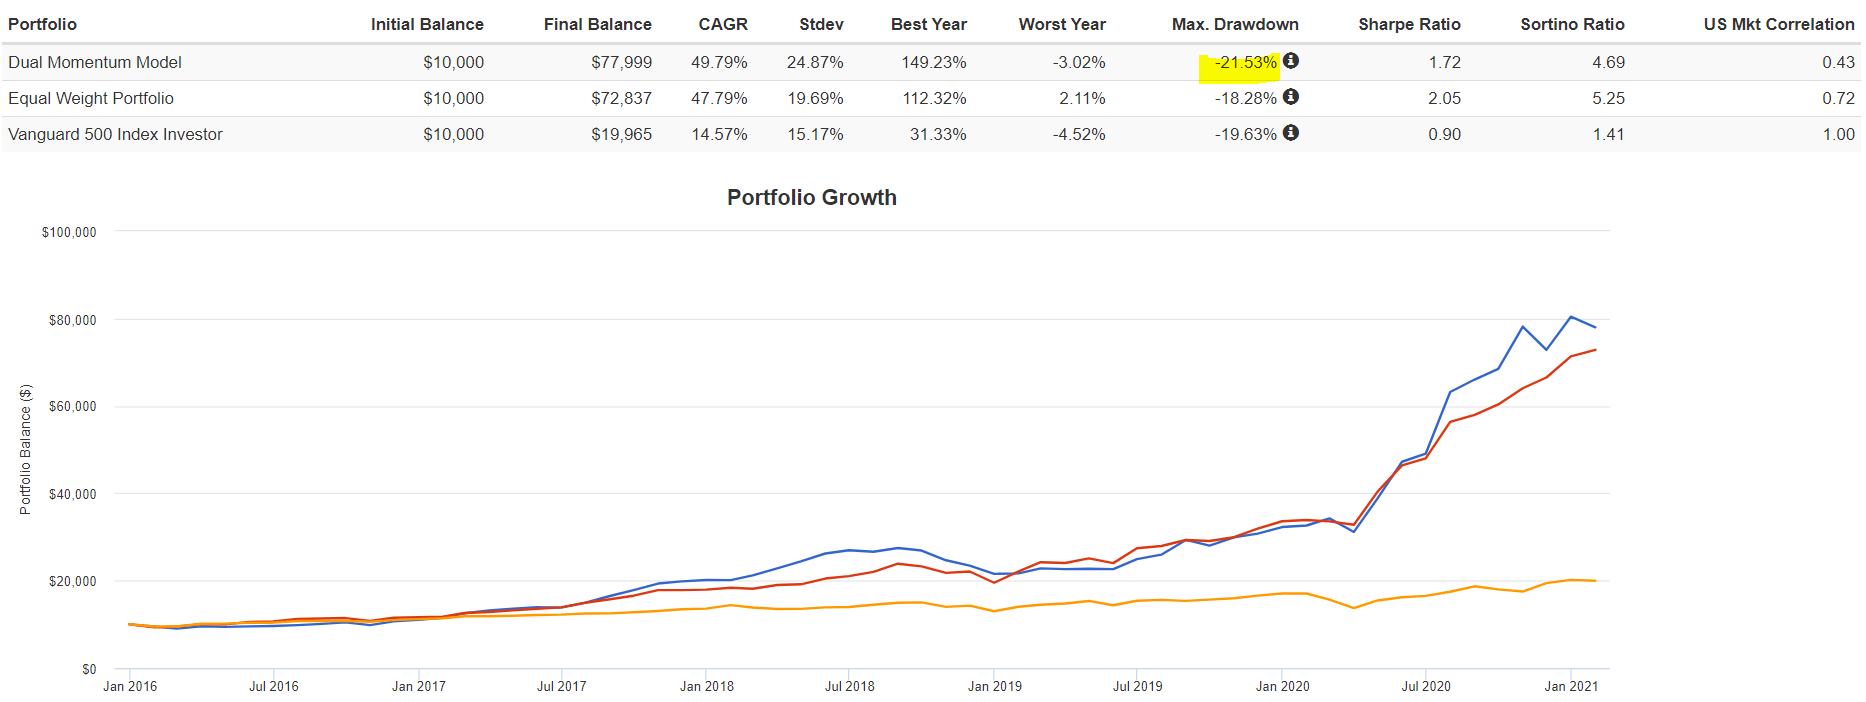
實驗七: XMMO前10名+MTUM前10名+冠軍策略(股票數19, 持股8, 出場持有VGLT, 一個月看一次,不使用單一絕對動能)

持股數可以不要4支嗎? 為了讓差異明顯一點, 我們直接把持股數*2變成8, 結果看起來也不錯,特別沒有一年是賠錢的,  但這樣每個月要比對跟再平衡8支個股, 也是一番工夫.

GNRC SEDG MPWR SAM MASI CGNX QDEL CRL TECH CABO TSLA AAPL MSFT AMZN NVDA TMO ADBE DHR GOOG

portfolio 
Dual Momentum Model 
Equal Weight Portfolio 
Vanguard 5m Index Investor 
COO 
Jan 2016 
Initial Balance 
$10,000 
$10,000 
$10,000 
2017 
Final Balance 
$89,131 
$69,609 
$19,965 
2017 
— Dual 
CAGR 
53.78% 
46.48% 
14.57% 
Std" 
22.21% 
18.67% 
15.17% 
Be St Year 
162.70% 
109.27% 
31.33% 
Worst Year 
Sharpe Ratio 
2.10 
Jul 2020 
Sortino Ratio 
073% 
264% 
452% 
Jul 2019 
-19.20% O 
-17.37% O 
-19.63% O 
Jan 2020 
US '"t Correlation 
0.84 
1.00 
Jul 2016 
Portfolio Growth 
2018 
Jul 2018 
— Equal 
2019 
— Vanguard 500 Investor
Start 
61 Feb 2021 
60 Jan 2021 
59 Dec 2020 
58 Nov 2020 
Fob 2021 
Jan 2021 
Dec 2020 
Nov 2020 
Month s 
Assets 
1 12.50% Apple Inc (AAPL) 
12 Corporation (CGNX) 
12.50% Charles River Laboratones International, Inc 
12.50% Generac Holdings Inc (GNRC) 
1250% Monolithic power Systems. Inc. (MPWR) 
12.50% SolarEdge Technologies, Inc. (SEOG) 
12.50% Bio-Techne corp (TECH) 
12.50% Tesla Inc (TSA) 
12.50% Apple Inc (AAPL) 
12.50% Cognex Corporation (CGNX) 
12.50% Charles River Laboratories Intemational, Inc 
12.50% Generac Holdings Inc (GNRC) 
12.50% Monolithic Power Systems, Inc. (MPWR) 
12.50% Boston Beer Company, Inc (SAM) 
12.50% solarEdge Technologies, Inc (SEDG) 
12.50% Tesla Inc (TSGA) 
1 12.50% Cognex Corporation (CGNX) 
1250% Generac Holdings Inc (GNRC) 
12.50% Monolithic Power systems. Inc. (MPWR) 
12.50% NVIDIA corporation (NVOA) 
1250% Boston Beer Company. Inc (SAM) 
12.50% so.arEdge Technologies. Inc (SEDG) 
12.50% Bio.Techne corp (TECH) 
12.50% Tesla Inc (TSLA) 
1250% Charles River Laboratories International. Inc. 
12.50% Generac Holdllngs Inc (CNRC) 
12.50% Monolithic Power Systems, Inc. (MPWR) 
1260% NVIDIA corporation (NVDA) 
12.50% Ou.del corporation (OOEL) 
12.50% Boston Beer Company, Inc (SAM) 
(CRL) 
(CRL) 
(CRL) 
A sset Perfo rmance 
AAPL: (y 
CGNX 229% 
CRL: 368% 
GNRC 836% 
-299% 
SAM: -7 
SEDG: -965% 
TSLA 1245% 
CGNX: 964% 
GNRCT 548% 
MPWR: 1462% 
NVDA: -2.56% 
SAM- 682% 
SEDG: 1480% 
TECH: 
TSIA 2433% 
300% 
GNRC: 269% 
011% 
NVDA- 692% 
ODEL: -2130% 
SAM: .1043% 
Dual Momentum Model 
0.73% 
g. 73% 
363% 
Equal Weight Portfolio 
264% 
Vanguard 500 Index Investor 
3.84% 
1094%
Model Simulation Results (Jan 2016 - Jan 2021) 
PDF Excel Save 
Systems, Company, 
Summary 
Metrics 
Annual Retums 
Monthly Retums 
Drawdowns 
Rolling Returns 
SolarEdge 
Technologies, 
Inc. (SEDG) 
-5598% 
20282% 
ÆS2% 
17091% 
23560% 
.965% 
Timing Periods 
Dual Momentum 
Equal Weight 
Vanguard 500 
Index Investor 
Year 
2016 
2017 
2018 
2019 
2020 
2021 
Inflation 
207% 
211% 
191% 
229% 
136% 
000% 
Return 
23.52% 
67.26% 
9.03% 
49.55% 
162.70% 
0.73% 
Balance 
S12,352 
S20,659 
S22,524 
93,685 
98,489 
S89, 131 
Return 
19.35% 
52.36% 
9.04% 
62.25% 
109.27% 
2.54% 
Balance 
Sli,935 
S18,185 
S19,994 
92,439 
$67,887 
$69,609 
Return 
1182% 
2167% 
452% 
3133% 
1825% 
.102% 
Balance 
Sli,182 
$13,605 
$12,989 
$17,058 
$20,171 
$19,965 
Holdlings 
Inc. 
(GNRC) 
36.85% 
21.55% 
102.39% 
Monolithic 
Power 
(MPWR) 
3004% 
3822% 
5479% 
10746% 
299% 
BOS 
Inc. 
(SAM) 
12.51% 
26.03% 
56.89% 
163.14% 
Masimo 
Corporation 
(MAS" 
6237% 
2582% 
26.62% 
4721% 
6980% 
464% 
Cogn ex 
Corporation 
(CGNX) 
8958% 
9291% 
.36.53% 
4564% 
4758% 
Quidel 
Corporation 
(ODEL) 
102.38% 
12.62% 
13944% 
Charles 
River 
Laboratories 
International, 
Inc. (CRL) 
8.22% 
43.65% 
3.41% 
3497% 
63.56% 
3.68% 
Bio- 
Techne 
Corp 
(TECH) 
1575% 
2741% 
1261% 
5267% 
4539% 
232% 
Cable 
one, 
Inc. 
(CABO) 
4513% 
1421% 
1777% 
8281% 
5043% 
.1022% 
Tesla 
Inc 
(TSLA) 
45.70% 
6.89% 
25.70% 
743 _ 
12.45% 
Apple 
Inc. 
(AAPL) 
12.48% 
48.48% 
88.97% 
82.31% 
055% 
Microsoft 
Corporaüon Am' 
(MSFT) In 
15.07% 
40.72% 
20.80% 
5787% 
42.53% 
420% 
Annual return for 2021 is from to 01/31/2021

1

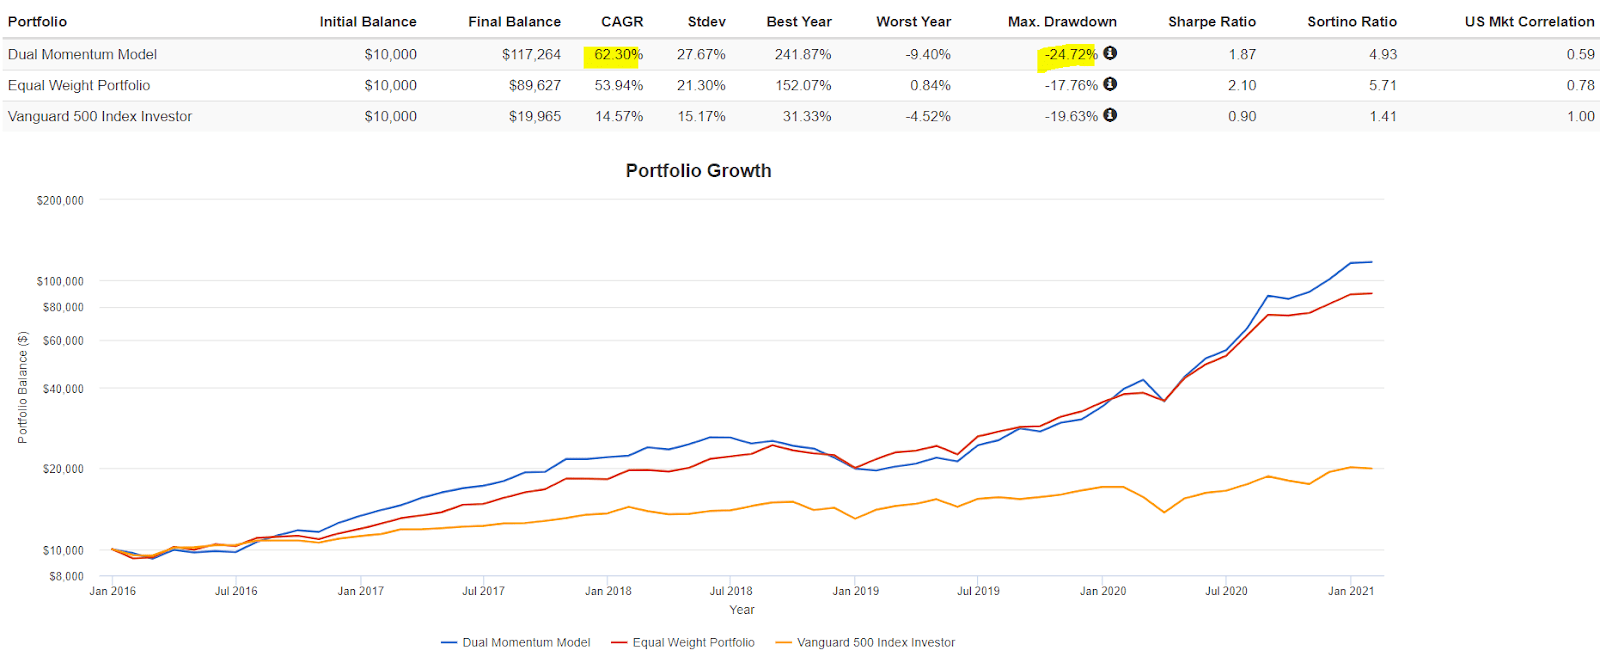
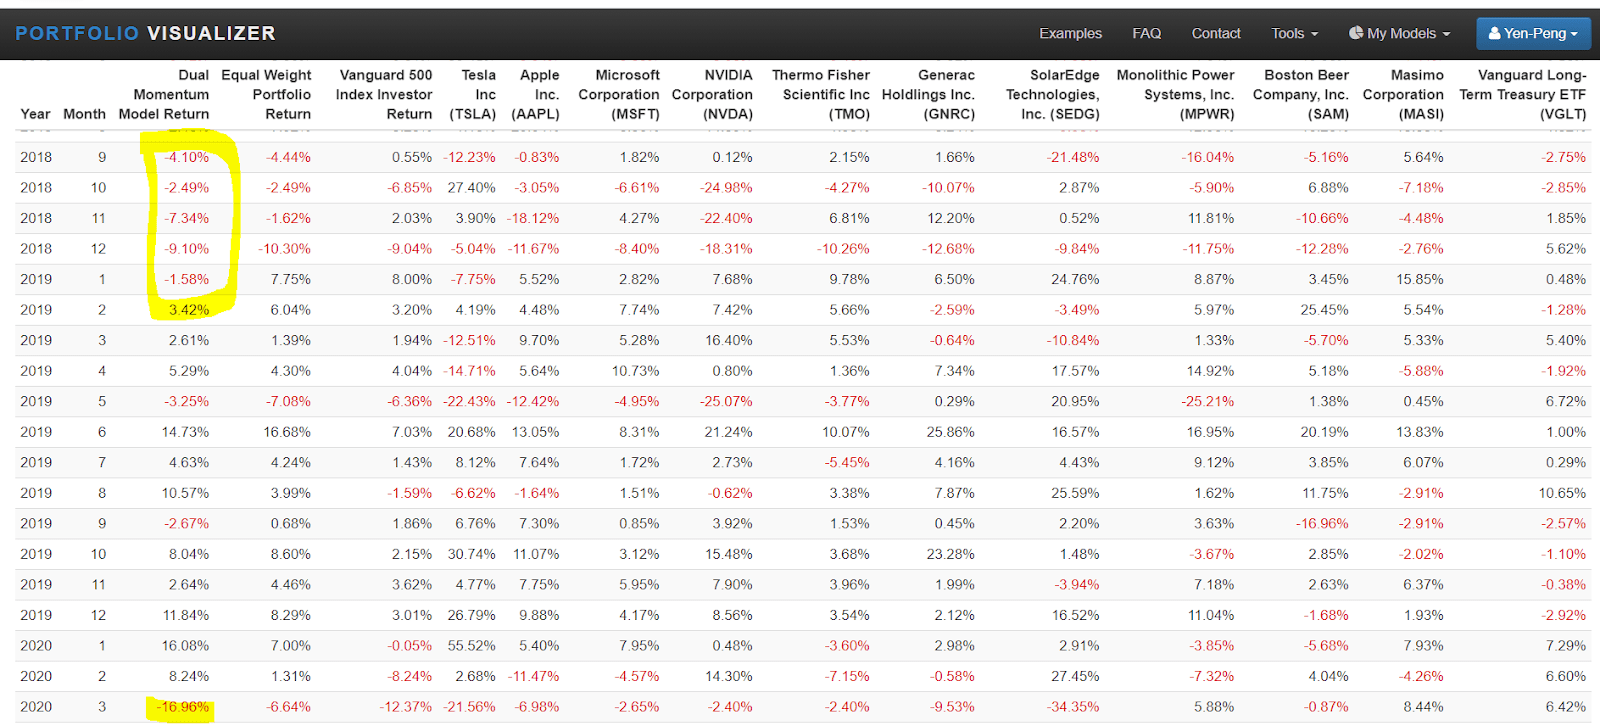
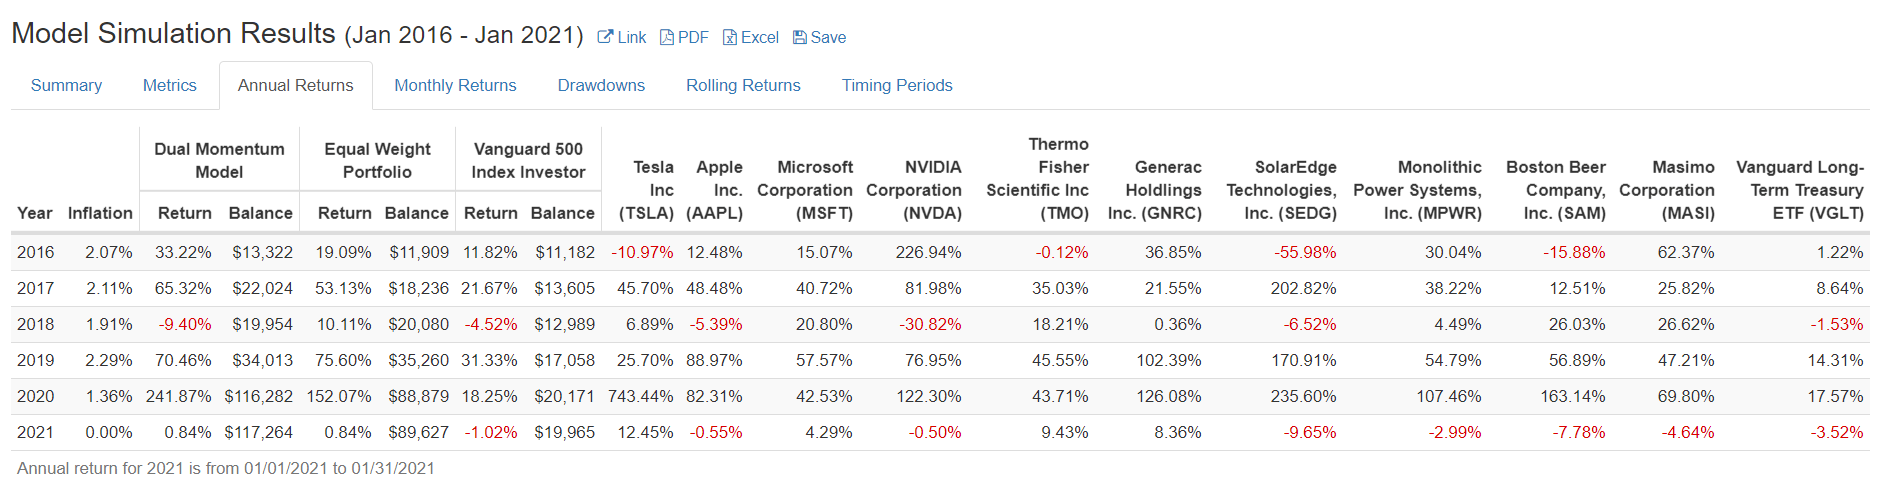
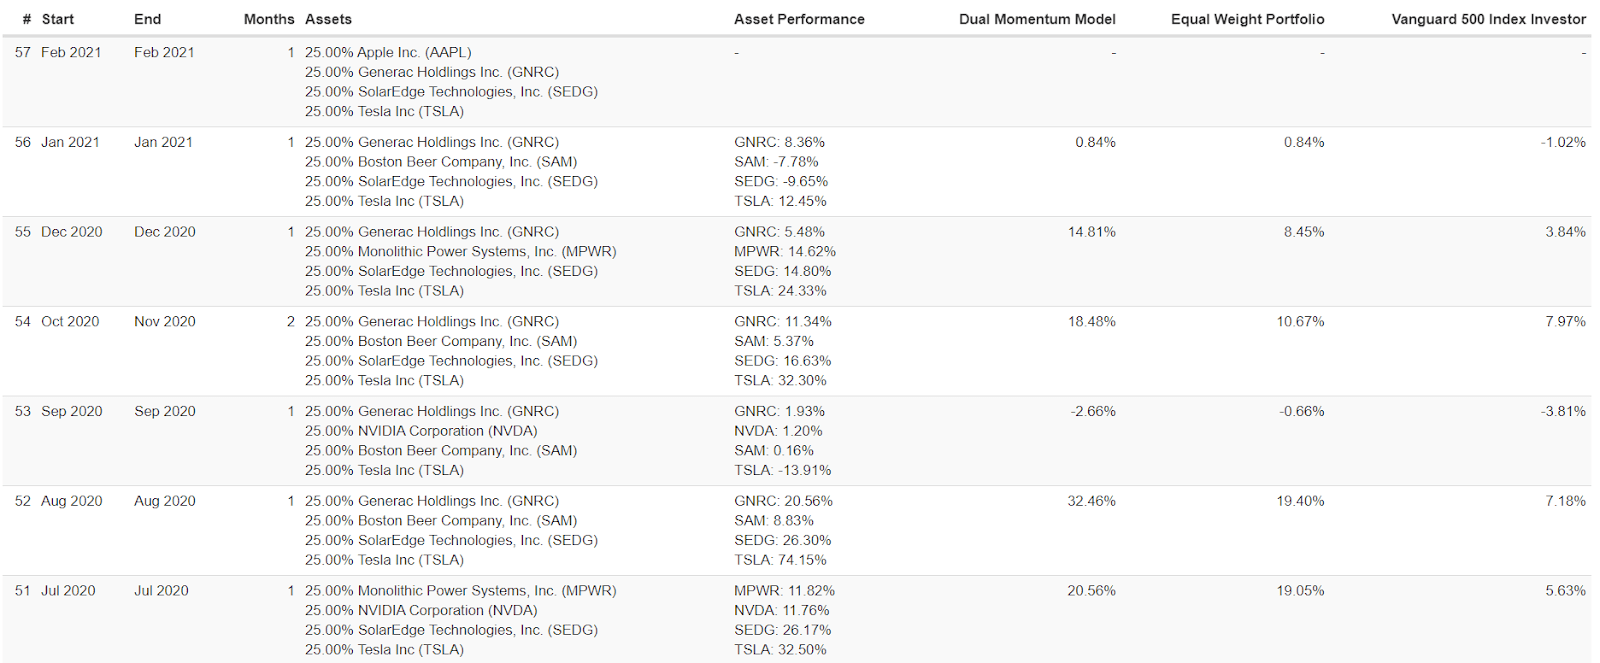
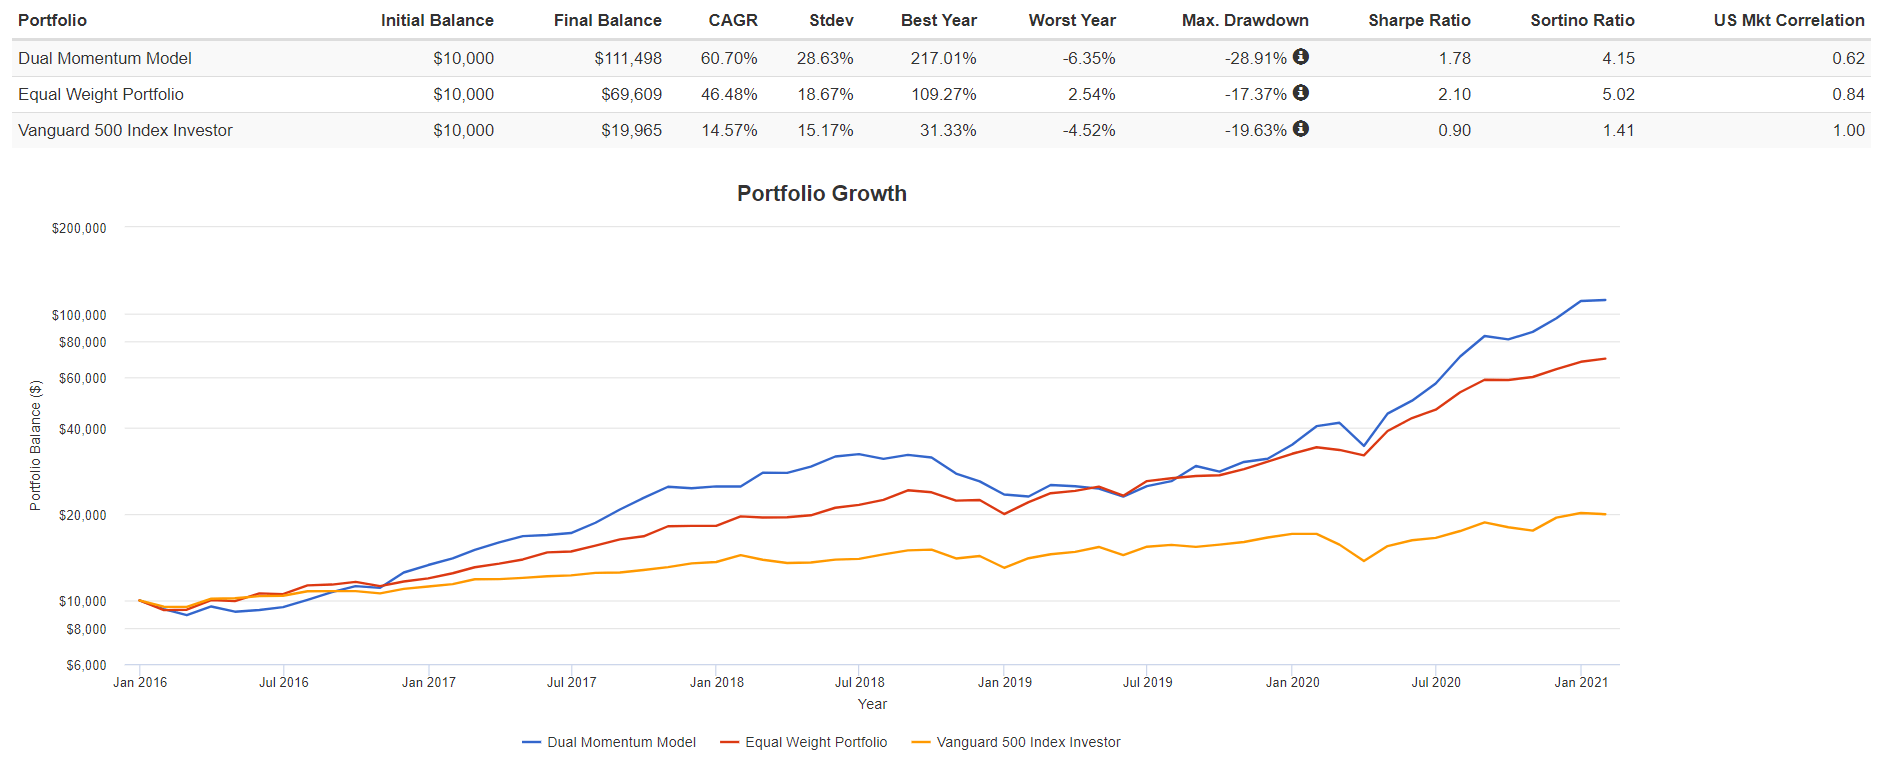
實驗八: XMMO前10名+MTUM前10名+冠軍策略(股票數19, 持股4, 出場持有VGLT, 一個月看一次,使用單一絕對動能:VOO) 就是它了!!

加入單一絕對動能當作總開關, 只要VOO(SP500)不好, 就全部持股換成VGLT.

由結果來看可以閃得掉大盤反轉時的輪跌, 拉回幅度變得比大盤還要小的-14.43%, 年複利報酬率62.99%.

GNRC SEDG MPWR SAM MASI CGNX QDEL CRL TECH CABO TSLA AAPL MSFT AMZN NVDA TMO ADBE DHR GOOG

Duel Momentum Model 
Equal Weight Portfolio 
Vanguard 500 Investor 
S200.000 
Sloc.ooo 
swooo 
S60.ooo 
s20,ooo 
SIO,ooo 
se,ooo 
Jn 2016 
Balance 
$10,000 
SIO.ooo 
$10,000 
Jan 2017 
Final 
Sli9,821 
$69,609 
$19,965 
h" 2017 
CAGR 
6299% 
4648% 
146/ % 
2267% 
1867% 
1517% 
Best r 
18035% 
10927% 
3133% 
Worst Year 
0.84% 
264% 
Jan 2019 
Max. Drawdown 
-1443% O 
o 
-1137% 
o 
-19.63% 
Jan 2020 
Sharpe Rado 
2.10 
Jul 2020 
Sortino Ratio 
681 
502 
US Wt Correlation 
023 
0.84 
1.00 
Portfolio Growth 
Jan 2018 
Jul 2018 
Jul 2019 
— Dual Momentum Model 
— Equal Weight Portfolio 
— 500 Index Investor

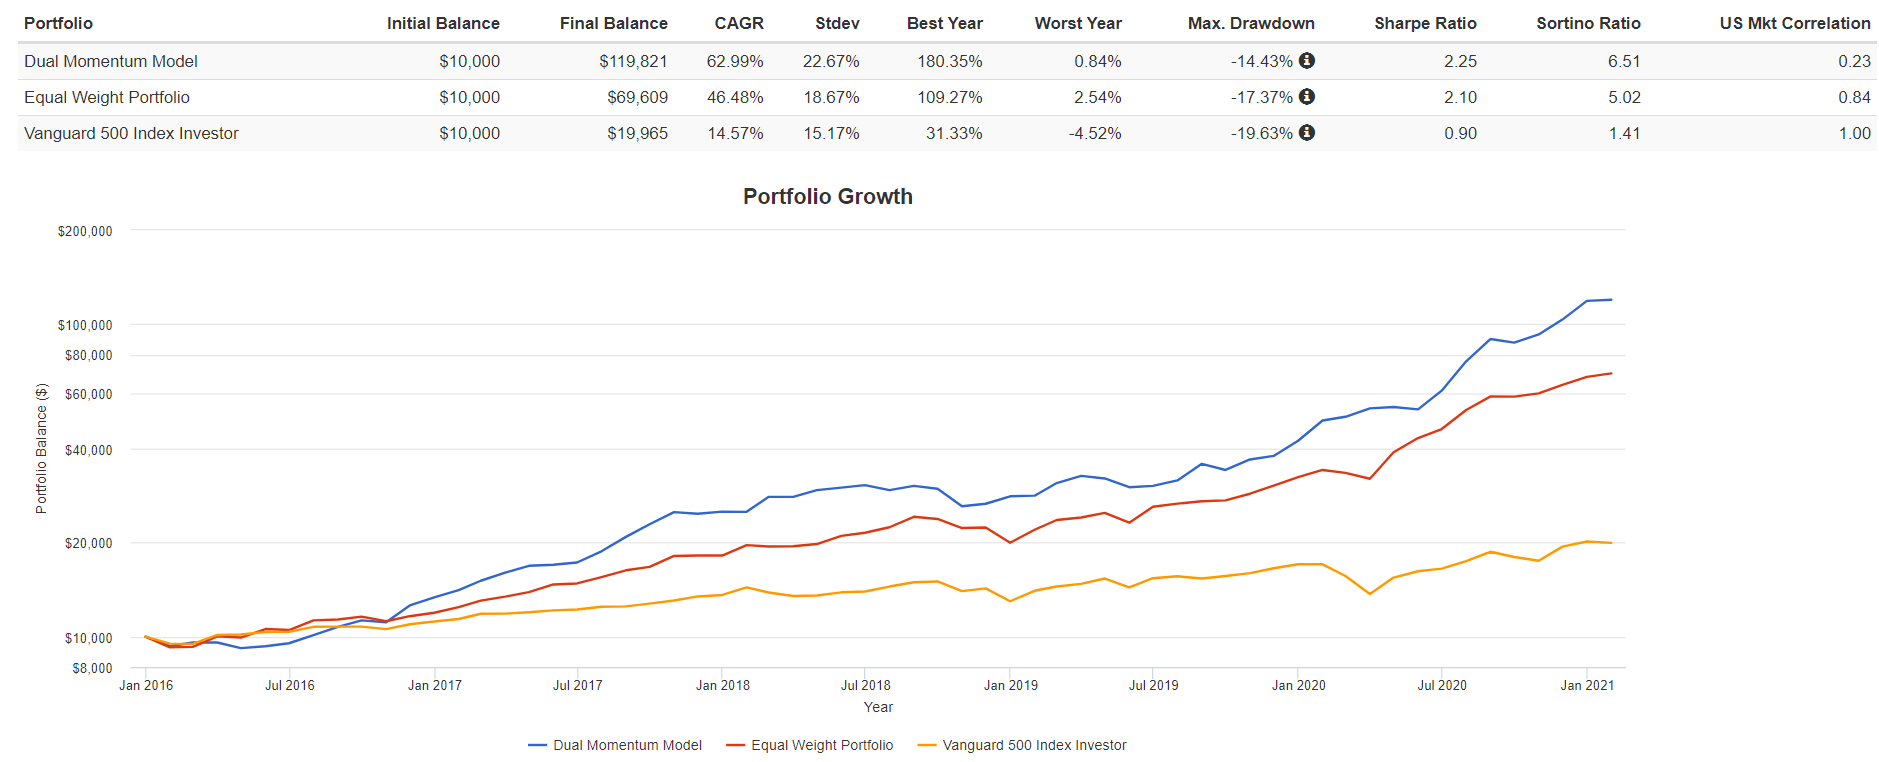
這幾年沒有大空頭, 不過在SP500大盤賠的2018年, 實驗八仍然是獲利的.

Model Simulation Results (Jan 2016 - Jan 2021) esave 
Summary 'vletrics Annual Returns 
Monthly Returns 
Drawdowns Rolling Returns 
Timing periods 
Dual Momentum 
Equal Weight 
Portfolio 
Vanguard 500 
Index Investor 
Year Inflation 
2016 
2017 
2018 
2019 
2020 
2021 
207% 
2.11% 
1.91% 
2.29% 
1.36% 
0.00% 
Return 
33.67% 
88.03% 
11.96% 
50.61% 
180.35% 
0.84% 
$13,367 
$25,135 
$28,141 
$42, 382 
Re turn 
1935% 
5236% 
6225% 
,935 
$18,185 
$32,439 
$69,609 
1182% 
2161% 
452% 
31.33% 
18.25% 
-1.02% 
Bal 
$11,182 
$13,605 
$12,989 
7,058 
$20,171 
Slg,965 
Gene rac 
HOI dl ings 
Inc. 
(GNRC) 
3685% 
2155% 
0.36% 
10239% 
126.08% 
8.36% 
SolarEdge 
Technologies, 
Inc. (SEDG) 
-55.98% 
202.82% 
-6.52% 
170.91% 
235.60% 
$118,818 10927% 
S11g,821 264% 
Monolithic 
Systems, 
(MPWR) 
30.04% 
38.22% 
4.49% 
54.19% 
-2.99% 
Bos ton 
Company, 
Inc. 
(SAM) 
-1588% 
1261% 
2603% 
5689% 
16314% 
-1.78% 
Ma simo 
Corporation 
62.37% 
25.82% 
26.62% 
47.21% 
_464% 
Cognex 
Corporation 
(CGNX) 
8968% 
9291% 
-3653% 
4554% 
4768% 
2.29% 
Qui del 
Corporation 
(QDEL) 
10238% 
1262% 
5369% 
13044% 
3970% 
Charles 
River 
Laboratories 
Intemational, 
Inc. (CRL) 
-5.22% 
43.65% 
3.41% 
34 _ 
63.56% 
3.68% 
Bio- 
Techne 
Corp 
(TECH) 
1575% 
2741% 
1261% 
5267% 
45.39% 
2.32% 
One, 
(CABO) 
4513% 
1421% 
17.77% 
8281% 
50.43% 
-10.22% 
Tesl a 
Inc 
(TSLA) 
-1097% 
4570% 
689% 
2570% 
14344% 
1245% 
Apple Microsoft 
Inc. Corporation Anu 
1248% 
4848% 
-539% 
8897% 
8231% 
-055% 
(MSFT) In 
1507% 
57.57% 
Annual return for 2021 is 01/01/2021 to 01/312021

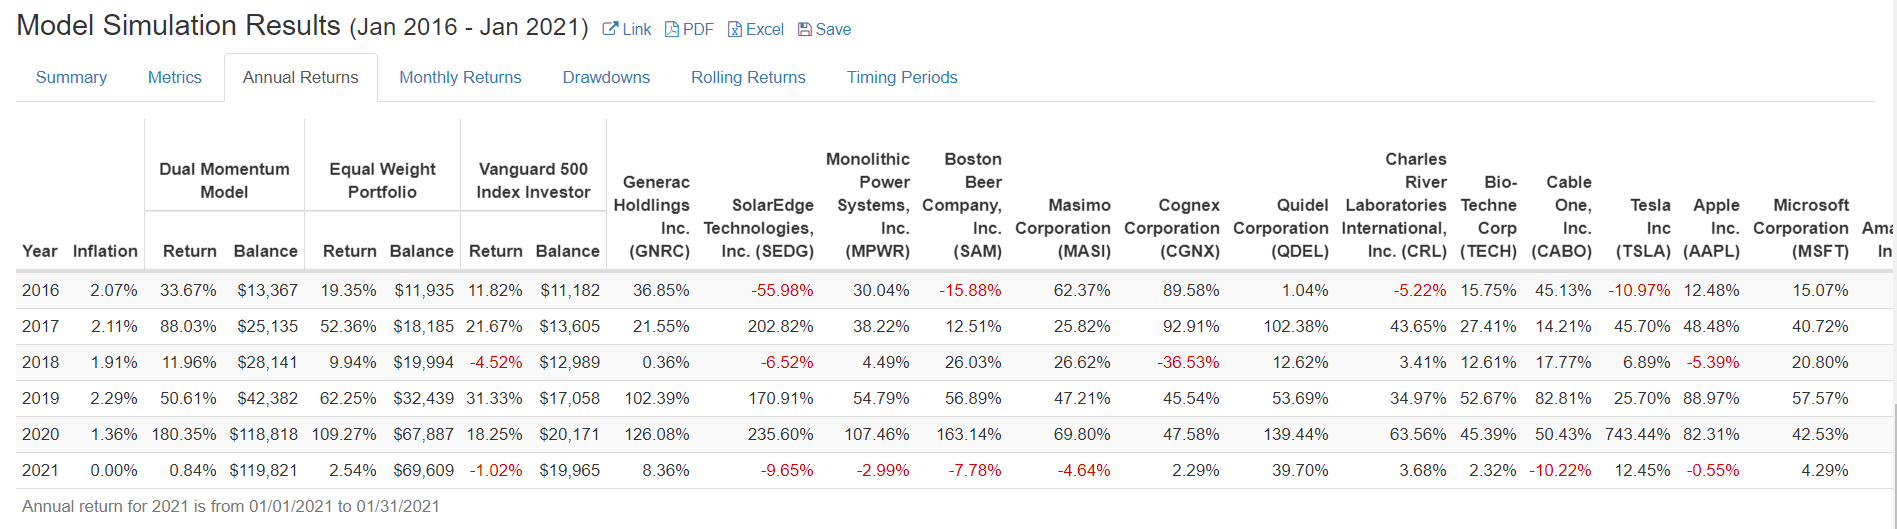
實驗六中2018年9月到2019月的拉回在實驗八得到大幅改善, 因為持股換成VGLT, 閃過了下跌.

Systems, Company, 
2018 
2018 
2018 
2018 
2018 
2018 
2018 
2018 
2018 
2019 
2019 
2019 
2019 
2019 
2019 
2019 
2019 
Momen tu m 
Model 
507% 
188% 
190% 
.368% 
324% 
.213% 
.1207% 
562% 
0.48% 
973% 
540% 
-187% 
.624% 
100% 
40996 
1301% 
Equal 
Weight 
Portfolio 
1.60% 
6.24% 
2.31% 
7.99% 
.10.64% 
1.89% 
7.03% 
12.48% 
2.32% 
500 1 ndex 
Investor 
037% 
23996 
061% 
371% 
325% 
055% 
.6B5% 
203% 
.904% 
32096 
194% 
.636% 
703% 
143% 
159% 
G e nerac 
Holdlinas 
Inc_ 
(GNRC) 
.196% 
1129% 
3.27% 
3.90% 
3.24% 
.ıom% 
12.20% 
.1268% 
6.50% 
.2.59% 
064% 
7.34% 
0.29% 
25.86% 
4.16% 
SolarEdge 
Technologies, 
Inc. (SEDG) 
JiD% 
608% 
.1432% 
112996 
.995% 
.21.48% 
287% 
0.52% 
.984% 
2476% 
.349% 
.ıo.84% 
1757% 
2095% 
1657% 
2559% 
Monolithic 
(MPWR) 
V15% 
1256% 
164% 
.o.74% 
1296% 
.16.04% 
Boston 
Inc_ 
SAM) 
13.25% 
1806% 
.826% 
1026% 
-516% 
688% 
.1066% 
.1228% 
Mas i mo 
Corporati on 
(MAŞI) 
10.39% 
.ı.41% 
1.81% 
1858% 
5.64% 
.7.18% 
.2.76% 
15.85% 
5.54% 
1383% 
.2.91% 
Cognex 
Corporation 
(CGNX) 
17.47% 
Quidel 
Corporation 
(QDEL) 
944 % 
1058% 
205% 
1329% 
.1523% 
.124% 
.550% 
.1973% 
18B7% 
1298% 
.014% 
.234% 
.1351% 
727% 
.049% 
6B1% 
Rİver 
La bora tori es 
International, 
Inc. (CRL) 
3.2D% 
4.41 % 
10.73% 
.o.64% 
8.93% 
.9.45% 
10.7D% 
.16.07% 
8.84% 
15.41% 
2.17% 
.ıo.69% 
.5.19% 
BİO- 
Techne 
Corp 
( TECH) 
.o.09% 
1.58% 
8.58% 
19.84% 
6.21% 
.17.83% 
.3.58% 
.ıo.35% 
20.55% 
11.33% 
2.4D% 
3.04% 
5.27% 
o.8D% 
.8.69% 
Cable 
One , 
Inc, 
(CABO) 
12.95% 
16.02% 
5.48% 
1.37% 
7.83% 
7.54% 
8.07% 
5.52% 
4.83% 
Tesla 
(TSLA) 
10.43% 
20 
.13.07% 
1.18% 
.12 
27 
3.90% 
5.04% 
20.68% 
.6. 
Apple 
Inc, 
(AAPL) 
1.50% 
13.51% 
2.80% 
20 
.o.83% 
.18.12% 
.ıı.67% 
5.52% 
9.7D% 
5.64% 
13.05% 
1.64% 
Microsoft 
Corporation 
(MSFT) 
2.47% 
.023% 
.6.61% 
427% 
.8.40% 
528% 
.495% 
Amazomcom, 
Inc. (AMZN) 
4.57% 
13.24% 
1181% 
.ıı.75% 
8.87% 
597% 
1.33% 
1492% 
.25.21% 
1695% 
9.12% 
162% 
3.45% 
2545% 
.570% 
518% 
2019% 
3.85% 
1175% 
NVIDIA 
Corporaton 
(NVDA) 
.2B9% 
1220% 
14.69% 
0.12% 
.24.98% 
.22.40% 
.18.31% 
7.68% 
16.40% 
0.80% 
2124% 
.o.62%

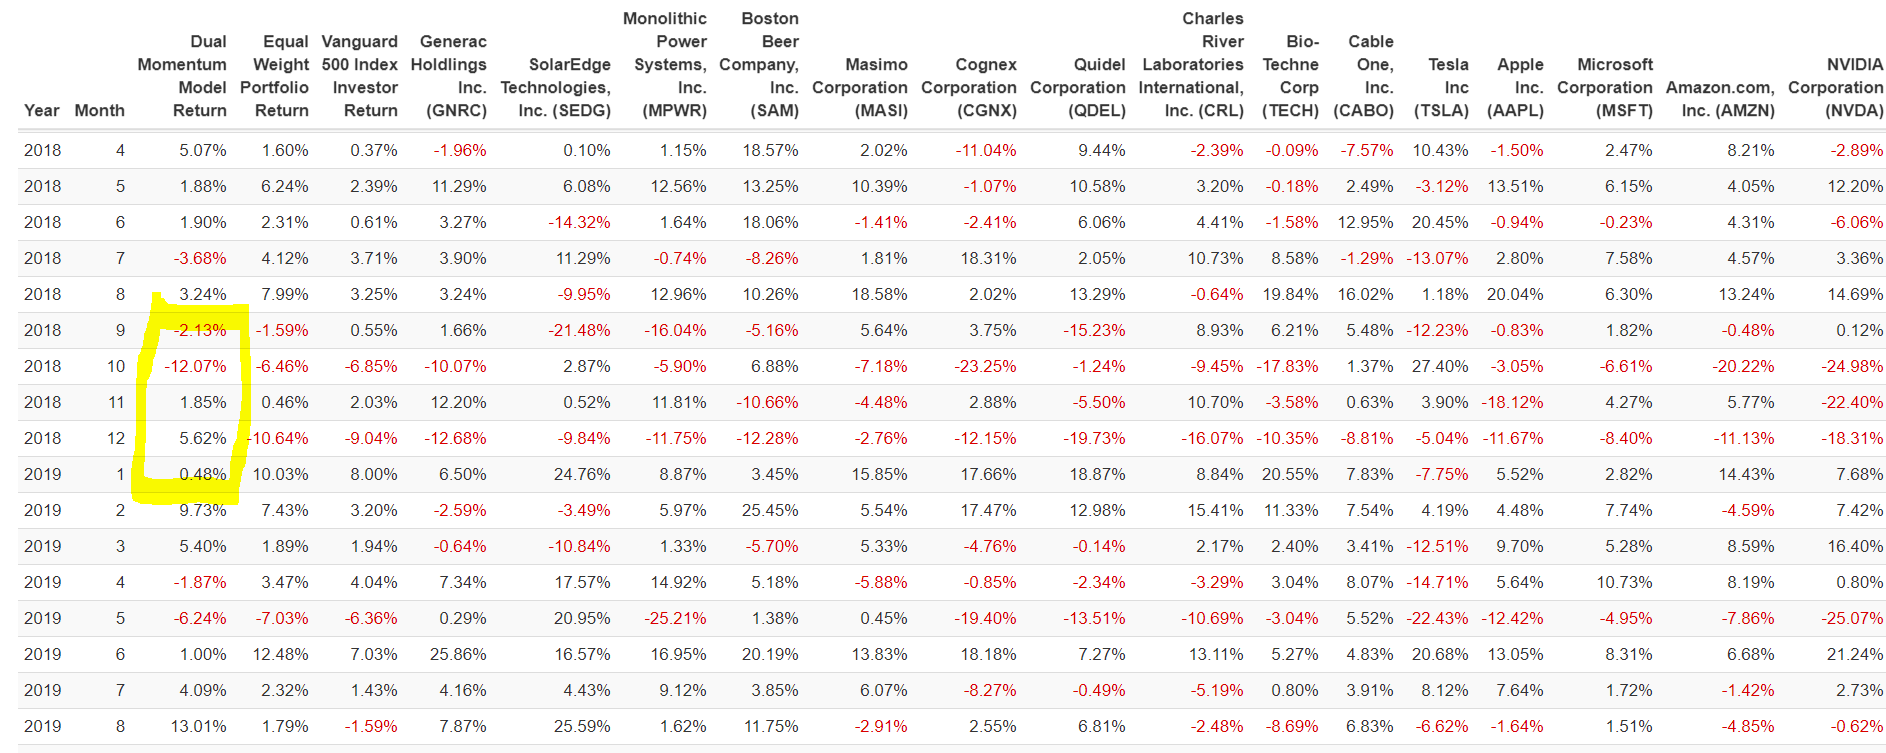
2020年初也是安全下椿, 看來就是這個了!

Systems, Company, 
2020 
2020 
2020 
2020 
2020 
2020 
2020 
2020 
2020 
2020 
2020 
2020 
2021 
Mon th 
Momen tu m 
Model 
1608% 
277% 
6.42% 
097% 
-173% 
1481% 
11 
1481% 
084% 
Equal 
Weight 
Portfolio 
-2.12% 
424% 
21.57% 
10.ge% 
6.91% 
15.09% 
1063% 
-OQI% 
6.49% 
6.09% 
2.54% 
500 1 ndeX 
Investor 
.005% 
-824% 
-1237% 
1281% 
476% 
198% 
-381% 
-2.67% 
384% 
-1.02% 
Generac 
Holdlings 
Inc. 
(CNRC) 
2.98% 
058% 
-953% 
458% 
1419% 
953% 
2924% 
2056% 
5.48% 
e.36% 
SolarEdge 
Technologies, 
Inc. (SEDG) 
291% 
2745% 
-3435% 
3628% 
2T16% 
-220% 
787% 
14.80% 
Monolithic 
(MPWR) 
-385% 
588% 
1324% 
1182% 
-2.99% 
Boston 
Inc. 
SAM) 
-568% 
404 % 
-087% 
2692% 
2105% 
_497% 
5102% 
et3% 
1764% 
Mas i mo 
Corpora on 
(MASO 
793% 
844% 
2077% 
1229% 
-345% 
176% 
454% 
Cognex 
Corporation 
(CGNX) 
30.84% 
5.25% 
11.97% 
-5.91% 
1.23% 
2.29% 
Quidel 
Corporation 
(QOEL) 
057% 
2663% 
2590% 
2785% 
2625% 
24.63% 
22.29% 
39.70% 
Charles 
River 
La bora tori es 
International, 
Inc. (CRL) 
1.19% 
064% 
-18.87% 
1463% 
1003% 
0.55% 
3.00% 
36B% 
Tech ne 
Corp 
(TECH) 
435% 
0.39% 
1866% 
1783% 
-02B% 
-705% 
1.89% 
20.29% 
4.59% 
2.32% 
C able 
One , 
Inc. 
(CABO) 
14.48% 
-757% 
4.51% 
1635% 
-1.23% 
-594% 
-10.22% 
Tesla 
Inc 
(TSLA) 
55.52% 
268% 
-21. 
4921% 
6.79% 
29 
3250% 
74M5% 
12.45% 
Apple 
Inc. 
(AAPL) 
5.40% 
.11.47% 
-6.08% 
1554% 
1474% 
1651% 
2166% 
-1025% 
9.55% 
11.46% 
-0.55% 
Microsoft 
Corporation 
(MSFT) 
7.95% 
457% 
.2.65% 
13.63% 
2.54% 
11.06% 
0.74% 
10.23% 
-6.74% 
6.01% 
3.90% 
429% 
Amazon.com, 
Inc. (AMZN) 
8.71% 
-6.22% 
-1.23% 
1296% 
1471% 
4.34% 
2.31% 
NVIOIA 
Corporaton 
(NVDA) 
0.48% 
14.30% 
-2.40% 
10.88% 
21.47% 
11.76% 
26.00% 
-736% 
6.92% 
-256% 
-0.50%

結論

  1.  MTUM和XMMO分別是美國大型及中型的動能型投資ETF, 選股的邏輯是買市場中表現最強勢的股票, 每半年重算一次, 善用的話可以省去大把選股的時間, 採用的話要注意上官網看再平衡後前10名的持股有沒有更換.
  2. 冠軍策略用在個股可能表現差異會很大, 因為少數個股相較於指數ETF更不容易掌握, 不過是以一個群組的方式持有, 就可以中和掉個股的波動.
  3. 阿批個人偏向用實驗八, 有夠多的股票來自大型股及中型股, 去給冠軍策略選, 分散性較好, 萬一有幾支同時狀況不好, 有夠大的樣本可以換, 持股4支就好, 不然每個月光重新平衡就要花一番心力, 再來個股波動較指數ETF為大, 使用單一絕對動能, SP500表現不好時全部換成VGLT, 減少心臟病發的機會.
  4. 執行時的價位一定會有誤差, 因為沒有人能真的用當月的收盤價進場(訊號還沒出來), 再來實際執行時會有滑價和買不滿整股的問題, 還有若是個股成交量很小, 有可能會換股不會那麼順利(若資本28億美金的XMMO都買得滿部位, 沒道理小散戶會有流動性問題才是), 若有能力用程式處理更佳.
  5. 使用時需算好部位的風險, 拉回的金額要是自己能承受的才行, 對阿批來說, 任何新的投資, 不管再有把握, 會投的資金都會控制在10%左右, 這樣就算失敗不會造成大的資產減損, 成功向上的空間滿可觀.
  6. Portfolio visualizer的訊號要付一個月19 USD給它, 可以自己去網路爬蟲來複製, 不過不建議就是了, 畢竟一個資金規模以上, 只要一個轉換時機不一樣, 差的數就會遠遠大過一個月 19 USD, 不要因小失大比較好.
  7. 以上只是個人的實驗, 並非投資買賣的建議, 再著過去的績效不代表未來, 回測模型的結果也可能只是幻覺, 如果要依此模式進場, 還需自行研究過喔.
  8. 如果各位看倌有耐心看到這裡, 想必也發現了, 一個組合裡只有4支持股, 在沒有漲跌幅限制的美股還是有他的風險在, 下面這篇, 看過了老師的推薦書目, 針對這個部份做了回測及修正, 有興趣也可看一下.

延伸閱讀: [賺贏大盤的動能投資法] 讀書心得及實驗

一堂必上的課

對於有在投資美股ETF的人, 阿批會強烈建議你一定要去上Cash和Jimmy的這堂”小資族ETF狠會賺投資法“, 原因是Cash 接觸程式交易、智能交易長達數十年,已協助超過百組客戶架構交易系統,也在多所大學與期貨商擔任講師。 Jimmy 擁有多年量化操盤經驗,開發過破百隻期貨,外匯交易策略,對策略管理與交易系統整合有深入研究,操作千萬以上資金。

這樣的人看待ETF投資的觀點, 肯定和市面上普遍告訴大家要被動投資、賺取市場報酬有非常有趣的差異, 看看做量化交易的人如何看待投資也是挺有意思.

阿批原來也只是抱著看看的心情, 看了之後才發現, “原來ETF可以這樣做….那麼簡單, 一個月才看一次, 報酬可以超越市場, 風險才一半..”

哇靠….我報酬率每年多幾個百分點, 還可以閃過金融海嘯….學費算什麼…

而且原來Portfolio visualizer還能這樣用…Timing Model那個選項之前想都沒想過..原來可以這樣做..

就算沒想要做比較進階的模型, 學到冠軍策略的原始版也夠本了!!

投資自己的腦袋, 不會錯!

You may also like

2 comments

讀書心得與摘要—FIRE財務自由 Financial Freedom - YYP on FIRE 5 2 月, 2021 - 1:01 上午

[…] 延伸閱讀: 真的假的? 1個年複利報酬60%的懶人美股及美股ETF投資組合!? […]

[賺贏大盤的動能投資法] 讀書心得及實驗 - YYP on FIRE 20 2 月, 2021 - 12:44 上午

[…] 延伸閱讀: 真的假的? 真的假的? 1個年複利報酬60%的懶人美股及美股ETF投資組合!? […]

Comments are closed.